CADJPY - Bearish BatCADJPY has completed a bearish harmonic structure near the 0.886 XA retracement, with price reacting from the D-zone around major resistance. The pair is currently attempting to push back upward after the initial rejection, but it remains below the main resistance/PRZ area.
In relation to the volume profile, price is trading near the upper portion of value, with heavier volume below acting as a potential magnet if rejection continues. RSI is rising back toward the upper range, so momentum is cu
Bat
EURCAD - Bearish BatEURCAD is approaching the completion of a Bullish Bat harmonic pattern near the ideal 0.886 XA retracement, aligning with a major demand zone and lower volume-profile support area.
Price has been rotating lower from the C-point with weakening downside momentum, while RSI is nearing oversold conditions.
This PRZ around the lower support zone is a key area to watch for bullish rejection and reversal confirmation.
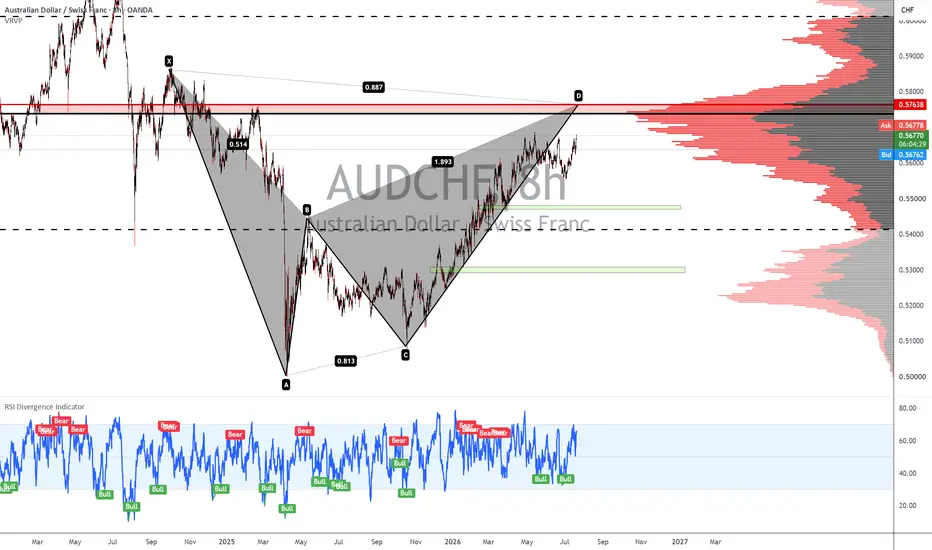
AUDCHF Bearish BatAUDCHF is approaching completion of a Bearish Bat harmonic pattern near the ideal 0.886 XA retracement, aligning with a major resistance zone and the upper high-volume area of the profile.
Price is pushing into the PRZ while RSI is elevated, suggesting momentum is strong but nearing a potential exhaustion area.
This zone is worth watching closely for bearish rejection, especially if price fails to hold above the 0.5760–0.5770 resistance region.
EURUSD Turtle Soup ReversalEURUSD has swept short-term sell-side liquidity and is now reacting from a precision breaker while respecting a nearby Fair Value Gap. If buyers continue to defend this area, the next objective is the cluster of buy-side liquidity resting overhead.
A classic Turtle Soup setup in the making.
Market Structure
• Sell-side liquidity has already been raided.
• Price is reacting from a precision breaker.
• A nearby FVG offers additional confluence.
• Buy-side liquidity remains the primary draw.
Bu
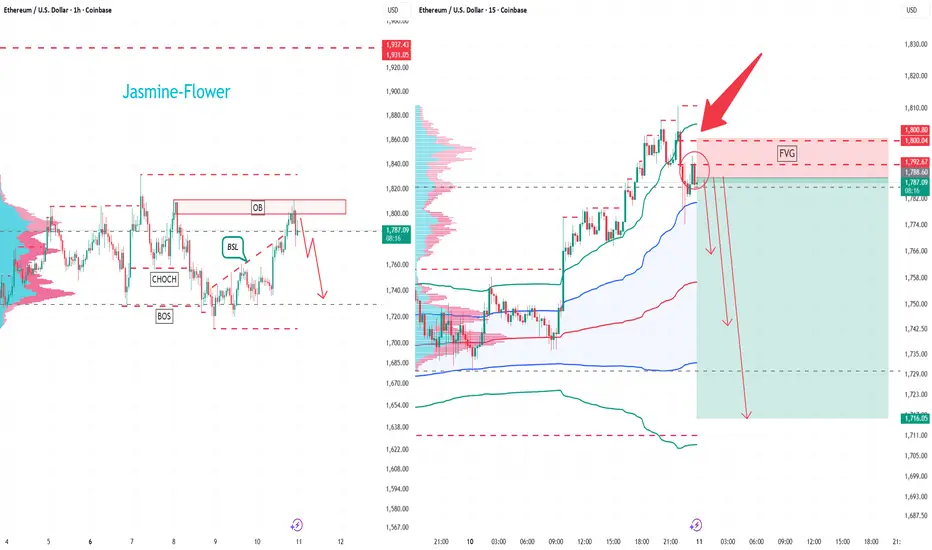
ETH/USDT 30-Minute Short Trading PlanETH/USDT 30-Minute Short Trading Plan
Timeframe: 30-Minute (ES Higher Timeframe Context)
Asset: ETH/USDT
Key Zones
Resistance Zone: 1800 – 1833
Support Zone: 1700 – 1730
Trade Setup
Trade Direction: Short
Entry Zone: Around 1786.00, initiate short position when price approaches the key psychological resistance level at 1800
Stop Loss Level: 1800.00; close the entire short position if price breaks above 1800
Take Profit & Risk Management Rules
1. First Target: 1768.00
Reduce half of total
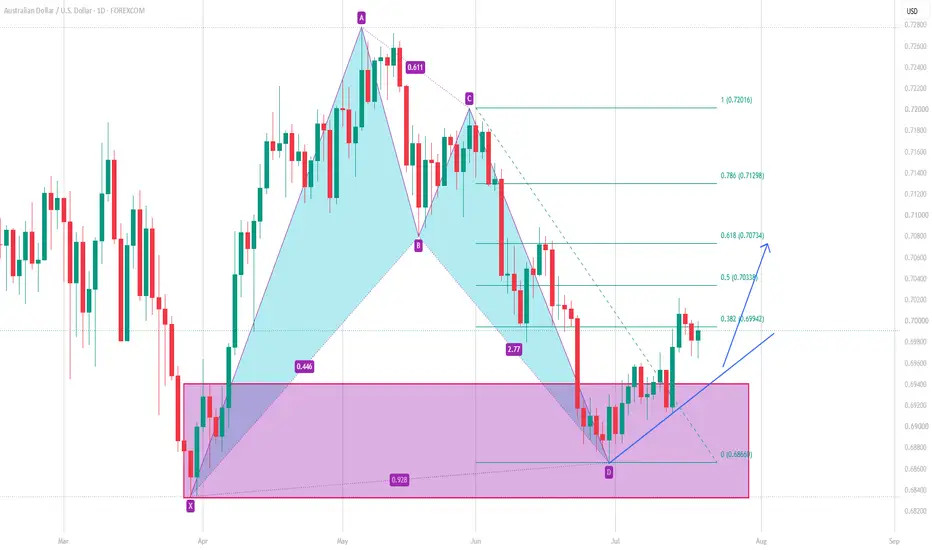
Ethereum's Bullish Bat Pattern Near CompletionEthereum's daily chart is forming a Bullish Bat Harmonic Pattern, with price now trading inside a key Potential Reversal Zone (PRZ). This area represents the completion of the pattern and coincides with a strong historical support level, making it a critical zone to watch for a bullish reversal.
A confirmed breakout from the descending trendline could shift momentum in favor of buyers, opening the door to upside targets at $2,800, $3,850, $5,000, and potentially $7,200 if the pattern fully play
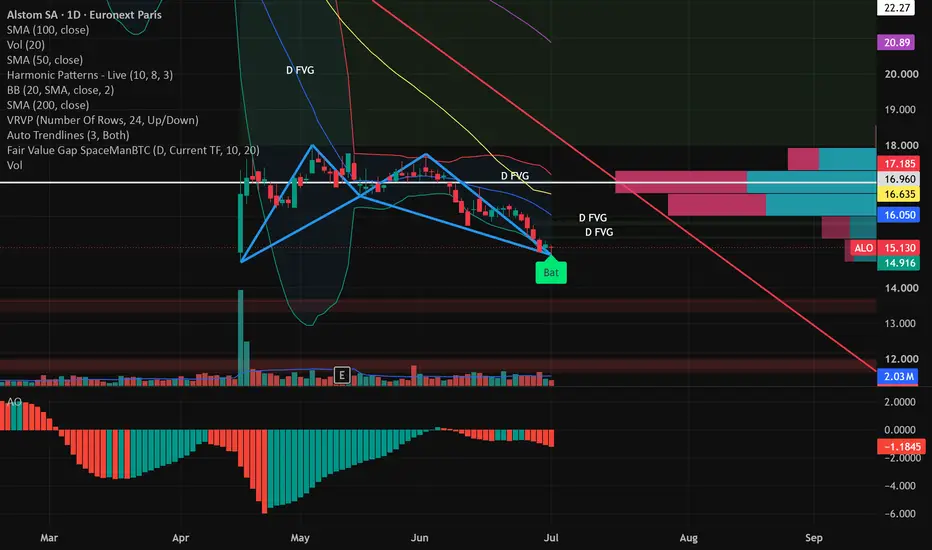
Harmonic pattern says BUY AlstomFundamentals:
The company had some issues after taking over Bombardier, and getting outdated equipment.
They selling their products in 5-10 year contracts, so the price is fixed but costs rising all the time. Margin is in danger. They issued new shares in 2024 wich was also a bad sign.
But. The european infrastructure needs new trains. They expanding to Kazahstan and Portugalia as manufacturing locations. Also won contracts in Egypt and India. I think the worst is over, inflation peaked. And i
Bitcoin is testing the critical $59K support zone.Bitcoin is testing the critical $59K support zone. As long as buyers defend this level, a relief rally toward the $66K to $68K resistance area remains possible. However, a confirmed breakdown below $59K would invalidate the bullish scenario and increase the probability of a deeper drop toward the mid $50Ks. ⚠️📉
CHFJPY - Bulish BatCHFJPY has completed a Bullish Bat harmonic pattern near the ideal 0.886 XA retracement, aligning with a key support zone and prior reaction level.
Price has already tested the PRZ and is showing early hesitation/reaction, while RSI is recovering from lower levels with recent bullish signals.
This is a key zone to watch for bullish reversal confirmation, but a clean break below the D-point/support would weaken or potentialy invalidate the setup.
BTCUSD - Bearish BatBTCUSD is forming a Bearish Bat harmonic pattern, with the projected D-point near the 0.886 XA retracement around the upper resistance/volume zone.
Price has reacted strongly from support and is now pushing through mid-range structure, while RSI has rebounded sharply from oversold conditions.
The setup is not complete yet, so the main focus is whether price can continue toward the PRZ and then show bearish rejection near the 64.2k–64.5k resistance area.
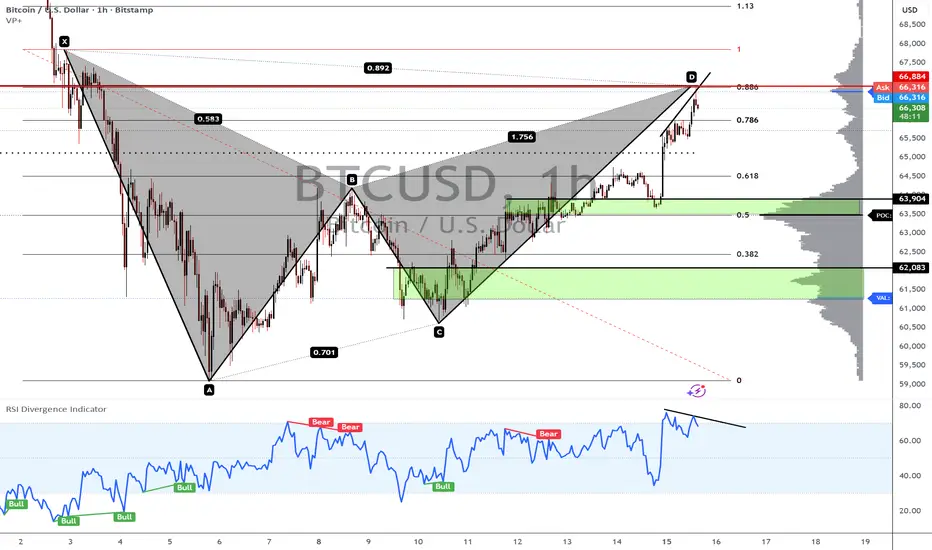
BTCUSD - Bearish BatBTCUSD has completed a Bearish Bat harmonic pattern near the ideal 0.886 XA retracement, aligning with major resistance, VAH, and prior swing-high liquidity.
Price is now showing an initial rejection from the PRZ, while RSI displays bearish divergence, suggesting weakening bullish momentum.
This remains a key area to watch for bearish continuation confirmation.
EURCHF Harmonic ConfluenceI am tracking a dual-layered structure.
First, a clean AB=CD corrective wave is moving back into the Fibonacci "sweet spot." More importantly, this move seems to be the final setup for a Bat pattern completion.
The Goal: The ultimate target for this structure is the 0.93000 psychological handle. I am standing aside and waiting for price to reach this terminal point before seeking confirmation near the D zone first.
However price could trend upwards and ignore the structure since a trend reve
BTCUSD - Bearish BatBTCUSD is forming a Bearish Bat harmonic pattern, with the projected D-point completing near the ideal 0.886 XA retracement around a major resistance zone.
The Potential Reversal Zone (PRZ) is reinforced by prior structural resistance, the upper edge of the current volume profile, and the Value Area High (VAH).
Additionally, bearish RSI divergence signals are developing as price approaches completion, suggesting weakening bullish momentum. This creates a strong confluence area where you can
USDCHF - Bearish BatUSDCHF is forming a Bearish Bat harmonic pattern, with the projected D-point completing near the ideal 0.886 XA retracement.
The setup is supported by confluence from a prior resistance zone, volume profile value area highs, and developing bearish momentum.
Price is approaching the Potential Reversal Zone (PRZ), making this a key area to watch for bearish rejection signals and signs of trend exhaustion.
XAUUSD - Bullish Bat**XAUUSD (4H) – Bullish Bat Pattern**
Gold is approaching completion of a **Bullish Bat harmonic pattern** near the ideal **0.886 XA retracement**, which aligns with a significant demand zone. The setup is supported by developing **bullish RSI divergence**, weakening bearish momentum, and favorable volume profile positioning. This area represents a strong confluence of harmonic, structural, and momentum-based factors, making it a key zone to watch for signs of a bullish reversal.
BTC heading sub 50K levels ?Declining channel is intact since October 2025, and price is respecting its boundaries by taking support & resistance form the lower & upper boundaries of the channel, as pointed by green and red arrow.
For the period of 4 months price consolidated near its support level of 62,300 and had showed multiple bounces in the upper direction, which couldn't sustain, now price is at an crucial point where, it's threatening the long standing support level so 60,000.
It 60k is out then consider a quick
GBPUSD SELL 1.3613On the 4-hour chart, GBPUSD has stabilized and rebounded, with short-term bullish momentum prevailing. Currently, attention should be focused on the resistance level around 1.3613; this level serves as the potential entry point for a short position based on a bearish Bat pattern, and it also falls within a previous supply zone.