XAUUSD H1 Short Trade PlanXAUUSD H1 Short Trade Plan
Instrument: XAU/USD
Timeframe: H1 (1 Hour)
Trade Bias: Short Sell (Market Entry)
• Entry: 4708.945 (Immediate market short entry at current price)
• Stop Loss: 4750.900
• TP1: 4662.500 → Close 50% position, move SL to break-even
• TP2: 4624.500 → Close another 50% remaining position, adjust SL to protect profit
• TP3: 4573.500 → Partial exit, trail stop loss higher to lock gains
• TP4: 4525.000 → Reduce remaining position, secure trailing protection
• Final leftover position: Hold freely with trailing stop protection, follow trend continuation
Risk Disclaimer
Gold and forex leveraged trading carries huge risks. Sudden news volatility and liquidity spikes may cause stop loss hunting. All analysis is for educational reference only, there is no guaranteed profit. All trading profits and losses are borne solely by the trader.
Bat
GBP/USD H1 Short Trade PlanGBP/USD H1 Short Trade Plan
Instrument: GBP/USD
Timeframe: H1 (1 Hour)
Trade Bias: Short Sell at market price
• Entry: Around 1.35970
• Stop Loss: 1.36230
• TP1: 1.35520 → Close 50% position, move SL to break-even
• TP2: 1.35150 → Reduce position, adjust SL to lock profit
• TP3: 1.34740 → Partial exit, trail stop loss for profit protection
• Remaining position: Hold freely with trailing stop protection
Risk Disclaimer
Leveraged forex trading involves huge potential risks. Sharp price fluctuations and news shocks may lead to stop loss being swept. All content is for educational purposes only, no profit guarantee. Traders take full responsibility for all trading gains and losses.
NZD/CHF H1 Short Trade PlanNZD/CHF H1 Short Trade Plan
Instrument: NZD/CHF
Timeframe: H1 (1 Hour)
Trade Bias: Short Sell at market price
• Entry: Around 0.46428
• Stop Loss: 0.46525
• TP1: 0.46270 → Close 50% position, move SL to break-even
• TP2: 0.46130 → Reduce position again, adjust SL to lock profit
• TP3: 0.45970 → Partial exit once more, trail stop loss for protection
• Remaining position: Hold with trailing stop protection following trend
Risk Disclaimer
Forex leveraged trading carries high risk. Sudden market volatility and news events may cause unexpected stop loss hunting. All analysis is for educational reference only, no guaranteed profit. All trading profits and losses shall be borne by traders personally.
Bitcoin Near Resistance — A Bearish Pattern Is Taking ShapeAs I expected in yesterday’s idea , Bitcoin ( BINANCE:BTCUSDT ) continued its downward move with the help of the Adam & Adam double top pattern and reached its target(Target Done).
Currently, Bitcoin is moving near the Cumulative Short Liquidation Leverage($78,540-$77,780), and the resistance zone($77,480-$76,740).
I expect Bitcoin to drop to at least the Cumulative Long Liquidation Leverage($75,710-$74,950) with the help of the Bearish Bat Harmonic Pattern after the lower line of the ascending channel is broken.
Target: Cumulative Long Liquidation Leverage($75,710-$74,950)
Stop Loss: $77,950
CME gap: $84,560-$79,660
CME gap: $69,535-$70,055
CME gap: $67,570-$67,170
What is your opinion on the short-term trend of Bitcoin?
💡 Please respect each other's opinions and express agreement or disagreement politely.
📌Bitcoin Analysis (BTCUSDT), 1-hour time frame.
🛑 Always set a Stop Loss(SL) for every position you open.
✅ This is just my idea; I’d love to see your thoughts too!
🔥 If you find it helpful, please BOOST this post and share it with your friends.
NRT GapsNRT Weekly Chart
Following up on earlier post, Target 1 is hit...
Typically bat patterns hit 38% and 61% targets which are shown on the chart, so far we have only hit 50% and formed a pin bar
The 61% target 2 aligns with a daily gap which makes it a natural target as chart traders do not like gaps... and tend to fill them over time
On the daily chart there are gaps both above and below the current price, give the weekly pin bar its entirely possible to see a medium term dip into the gap zones... followed by another push higher to close the 61% target 2 and gap close which would be a good place to exit
No specific setup for me at present....
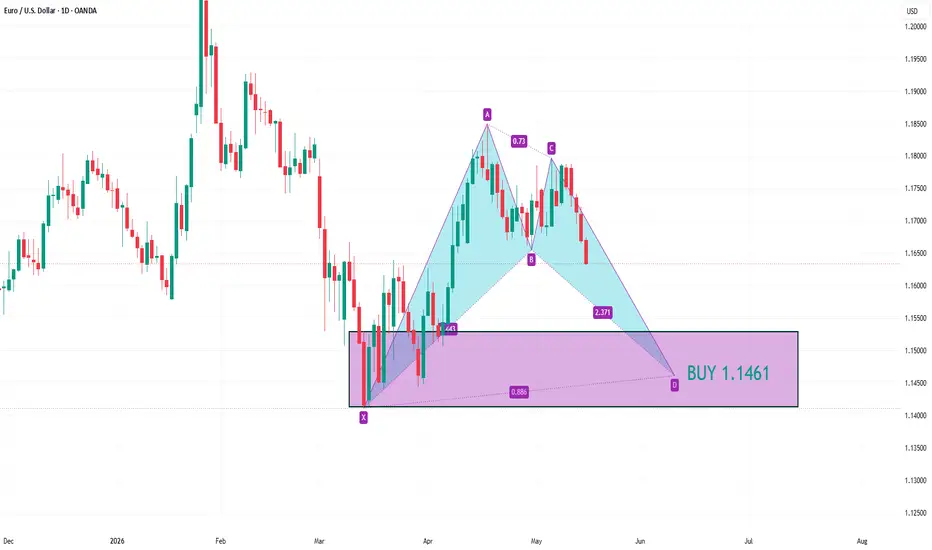
USDCHF BUY 0.7870On the daily chart, USD/CHF stabilized and moved upwards after forming a bullish bat pattern. Currently, we can pay attention to the support around 0.7870. If it pulls back and stabilizes, we can consider buying again. The upside target is around 0.7925, and if it breaks through, the next target is around 0.8000.
Trade Plan: GBPUSDTrade Plan: GBPUSD
• Direction: Short
• Entry: 1.34750
• Stop Loss: 1.35130
• TP1: 1.33370
• TP2: 1.32300
• TP3: 1.31130
Take partial profits at each target, then trail stop to protect profits.
Analysis based on market structure, volume profile and harmonic pattern.
Not financial advice.
Trade Plan: AUDUSDTrade Plan: AUDUSD
• Direction: Short
• Entry: 0.70549
• Stop Loss: 0.71000
• TP1: 0.69800
• TP2: 0.69135
• TP3: 0.68000
Take partial profits at each target, then trail stop to protect profits.
Analysis based on market structure, volume profile and harmonic pattern.
Not financial advice.