AUDCAD — Bearish Shark Harmonic PatternAUDCAD is approaching a very important area on the chart where a Bearish Shark harmonic pattern is completing.
The Potential Reversal Zone (PRZ) around 1.0250 is the main area to watch. Price has made a strong move higher into this zone, so a rejection here could start a larger move to the downside.
Another important part of the setup is the trend channel. Price has been moving higher inside the rising channel, with the upper channel line now lining up closely with the Potential Reversal Zone.
Bearish Shark
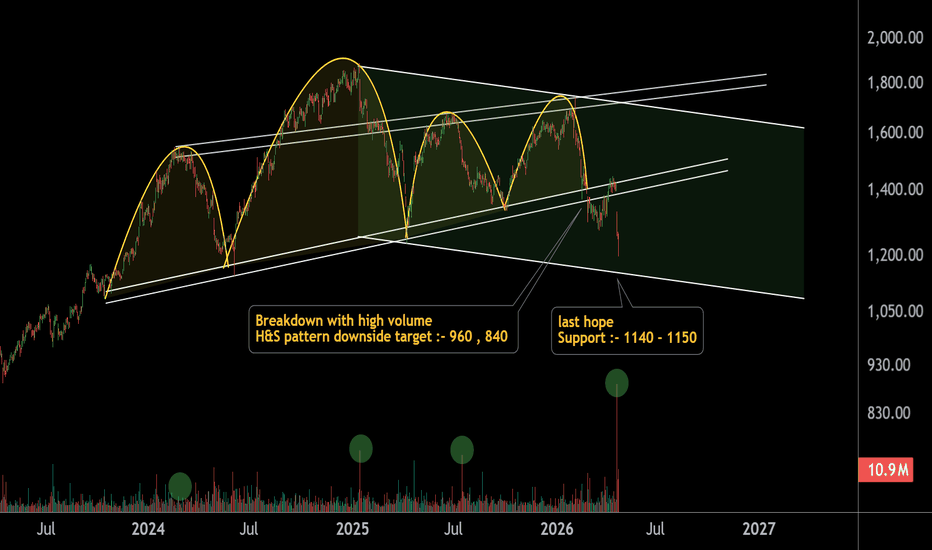
HCL Technologies Ltd – Technical Breakdown Alert The chart reflects a mature topping formation in the form of a Head & Shoulders pattern, developed after an extended uptrend—indicating a probable trend reversal phase.
A decisive neckline breakdown, supported by expansion in volume, confirms distribution at higher levels. Price has now slipped below the intermediate trendline, signaling weakening momentum and loss of bullish structure.
From a structural standpoint:
The right shoulder rejection near resistance confluence adds conviction to th
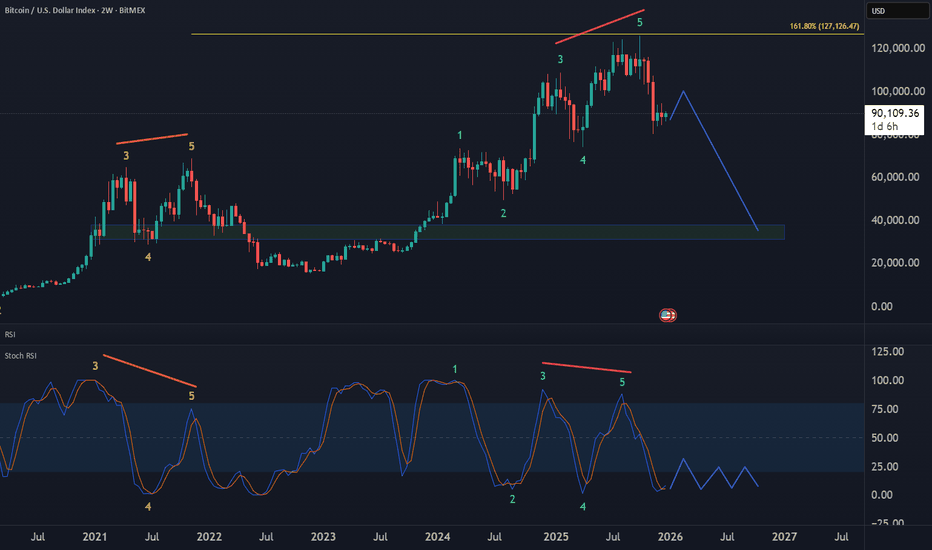
Bitcoin Bear Market Outlook🔴 Over the next 10 months, INDEX:BTCUSD is expected to correct the entire rally from the 2022 low, with downside potential toward the 37K – 30K zone to retest the previous base.
🔵 The structure of the decline remains uncertain, it could unfold as a sharp aggressive drop or a slow bleeding move.
#ElliottWave #Crypto #Trading
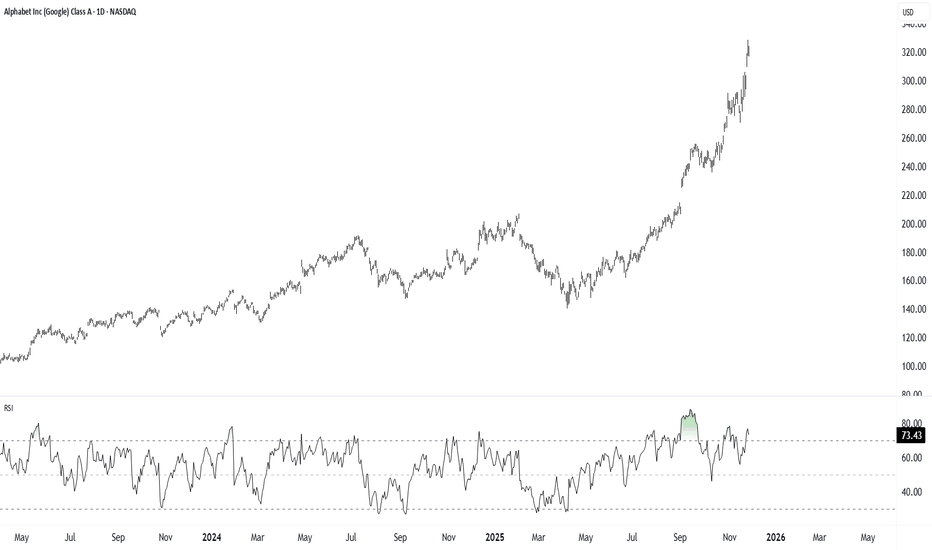
Google at record highs but Wave 3 cluster/RSI screams pullback!Alphabet is leading the Magnificent Seven, hitting record highs near $330, while most AI and growth stocks, including Nvidia, have stalled. Since launching Gemini 3 in mid-November and with news of a $4.9 billion Berkshire stake, Alphabet has rallied more than 135% off its April low, outperforming all Big Tech peers in 2025.
But Alphabet is at the 161.8% Fibonacci extension of its long-term move and long-to-medium-term move, which matches a textbook Elliott Wave 3 cluster completion. RSI is at
$BTC Bearish Divergence on 1H Chart Near Key Support#BTC BearishBTC/USDT on the 1-hour timeframe is flashing a bearish structure with clear divergence. The immediate correction zone looks to be around $111K, with the $110.8K support acting as the deciding level. If that floor gives way, we could see a sharp drop toward $98K. But if buyers defend the level, it may reset as a new higher low, setting up continuation. With Fed data on deck today, expect liquidity grabs both ways—first stop likely downside before any rebound.
IWM Appears Due for a Minimum 40-60% Downside CorrectionOn the lower timeframes IWM has been treating $223 as short term support with much sold put leverage building at $220 and recently IWM has begun to retrace back down into those levels putting those sold puts at risk of expanding the volatility and of squeezing through these short puts as a result.
The short term the loss of this zone could likely squeeze down to $200.
However in the longer term we have been trading within this much larger parallel channel since the peak and bottom of 2008-20
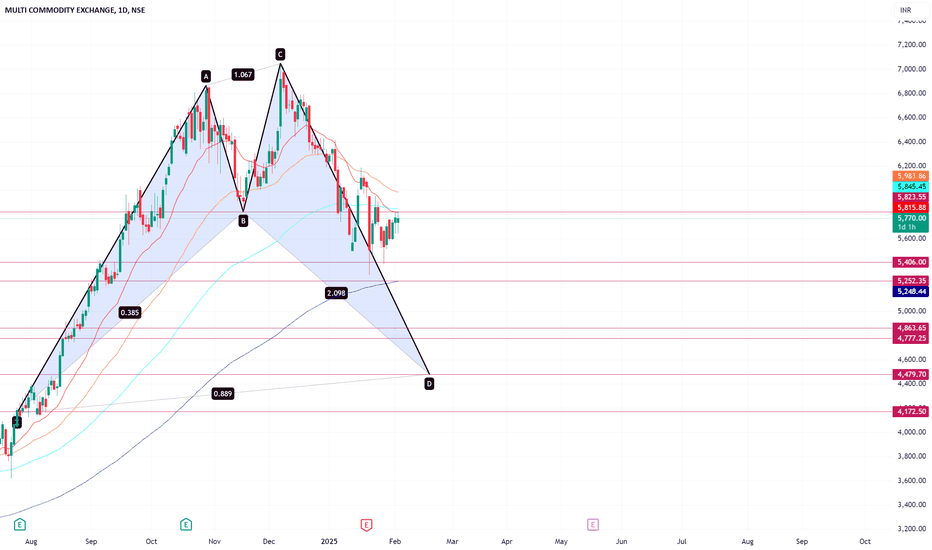
Bearish Shark Pattern with a Massive Profit FactorThis is how trading should be done . I've just spotted a Bearish Shark Pattern on the Weekly Chart and while it's not perfect, it's still a great trade worth keeping on the radar. The market has been hovering around the entry price for weeks, which tells me something is brewing.
The Smart Approach:
Now, I’m not entering based on the Weekly Chart alone , that would require a stop-loss that’s way too wide. Instead, I look for an execution timeframe within three levels down. That means the l
Bitcoin (BTC/USD) Reversal? Rising Wedge Breakdown Signals Sell! The chart suggests a potential bearish move after a rising wedge pattern breakdown.
Key Observations:
Rising Wedge Breakdown:
BTC formed a rising wedge, which is a bearish reversal pattern.
The price has broken down from this wedge, indicating a potential downtrend.
Support and Resistance Levels:
Resistance Zone: Around $88,188 – $88,792, marked as a key level where selling pressure may increase.
Support Zone: Around $85,368 – $84,226, where buyers may step in.
Target: $81,429 – $81,258,
GBP/USD Breakdown – Bearish Momentum Ahead?This 4-hour chart of GBP/USD shows a clear bearish setup:
🔹 Rising Wedge Breakdown – The pair has broken below a rising wedge pattern, signaling potential downside pressure.
🔹 Support and Resistance Levels –
Resistance at 1.29206 - 1.30275
Support at 1.28000 - 1.28437
Strong support at 1.27539
🔹 Sell Confirmation – A sell signal is indicated, suggesting further downside movement towards the target zone.
📉 Trading Plan:
✅ Possible short entries below the 1.28956 level.
✅ Target price: 1.2753
USD/JPY 4H Analysis – Potential Bearish RetestThe USD/JPY pair has been in a clear downtrend, trading within a descending channel for an extended period. Recently, price action has broken above the channel, but it is now facing resistance around the 150.35 level.
Retest Zone: The pair is currently retesting the broken trendline, and if it fails to sustain above this level, a rejection could lead to further downside.
Bearish Expectation: If the price fails to reclaim 150.35, a move towards the 147.00 support zone is likely.
Confirmation:
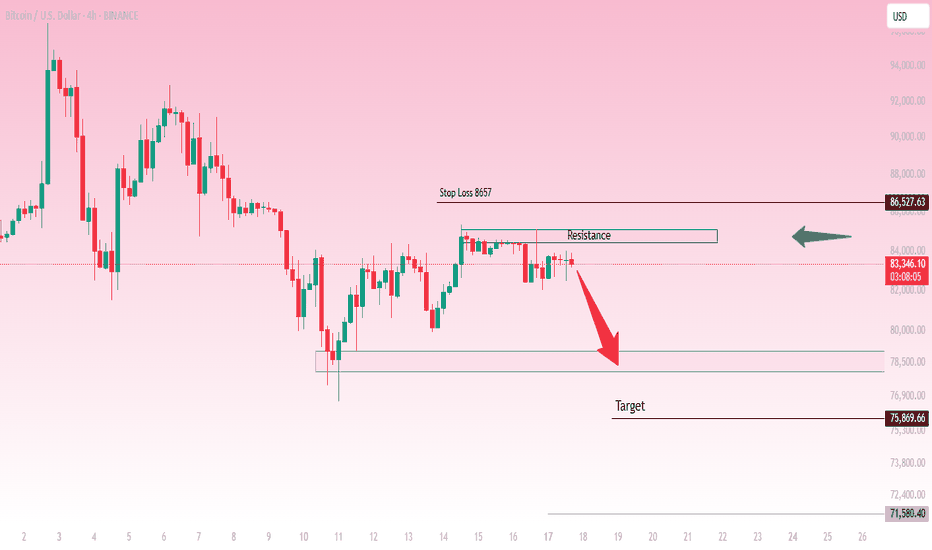
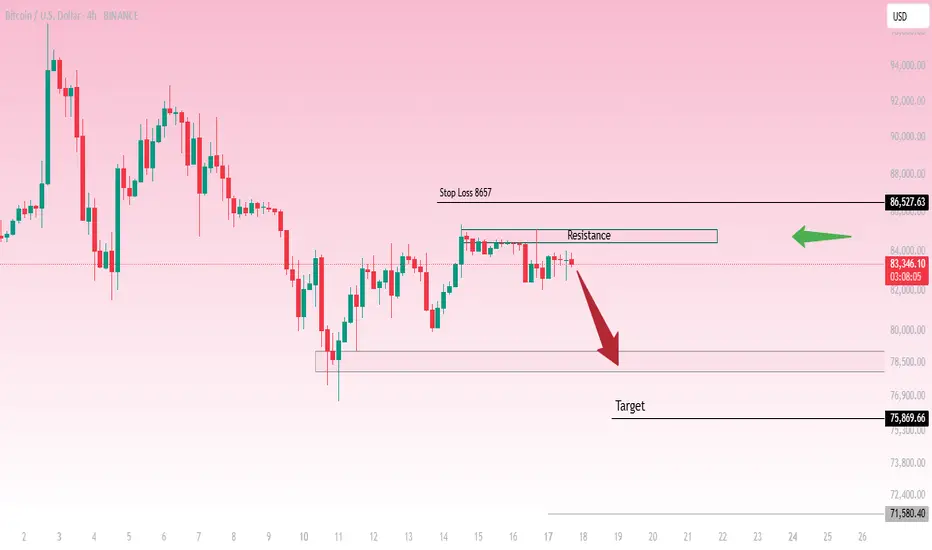
This is a 4-hour chart of Bitcoin (BTC/USD)This is a 4-hour chart of Bitcoin (BTC/USD) showing a key resistance level around $86,527 and a potential bearish move towards lower support zones.
Analysis:
Price is currently trading near the resistance zone, struggling to break above it.
A sell setup is suggested, expecting rejection from resistance.
The first target is around $78,500, with an extended downside target at $75,869 and possibly $71,580 if momentum continues.
A stop-loss level is placed above resistance at $86,527, indicating a
ONDO making a parabolic move here. It’s difficult to call what ondo just broke upward from a cup and handle because the handle is extremely small even on small time frames as small as the 1hr timeframe, however there is some bullish confluences that if you treat it the same way you would treat a cup and handle to ensure the breakout target, you find that the target is exactly at the 1.618 Fibonacci level which is a very common breakout level that things tend to climb two when the breakout up from a previous pattern and surpass th
Ondo’s parabolic move on the 1day chartThis is the same chart I jsut posted except this time it’s shown here on the 1day timeframe” It’s difficult to call what ondo just broke upward from a cup and handle because the handle is extremely small even on small time frames as small as the 1hr timeframe, however there is some bullish confluences that if you treat it the same way you would treat a cup and handle to ensure the breakout target, you find that the target is exactly at the 1.618 Fibonacci level which is a very common breakout le
HARROW 16% INTRADAY DROP CAUGHT!Technical Analysis: HARROW (15-Minute Timeframe)
This chart demonstrates a highly profitable short trade executed with precision using the Risological Indicator. A stellar 16% profit was captured in this intraday trade, showcasing the power of momentum trading.
Trade Details
Stock: HARROW
Timeframe : 15-Minute
Entry Price : $52
Exit Price : $43
Profit : $9 per share (16% intraday return)
Key Technical Observations
Perfect Entry Point:
The entry at $52 aligns with the beginn
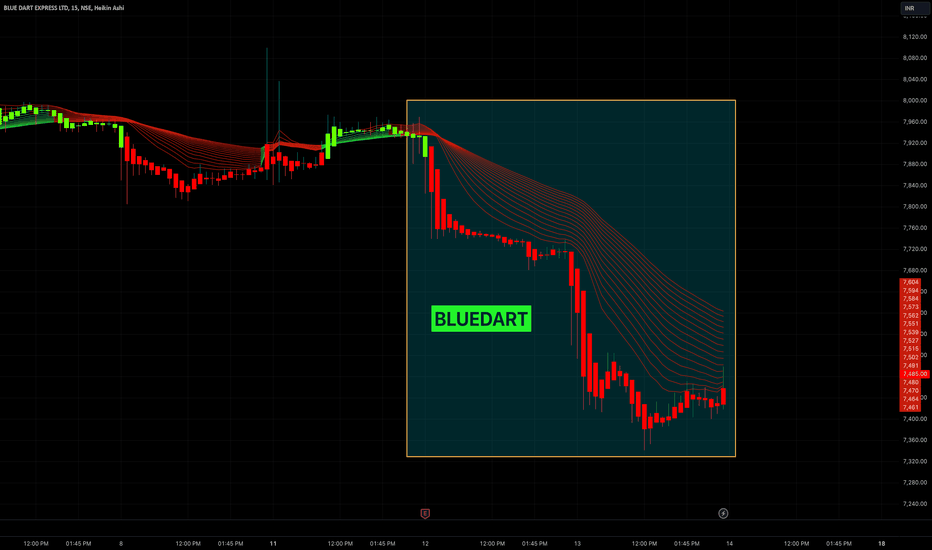
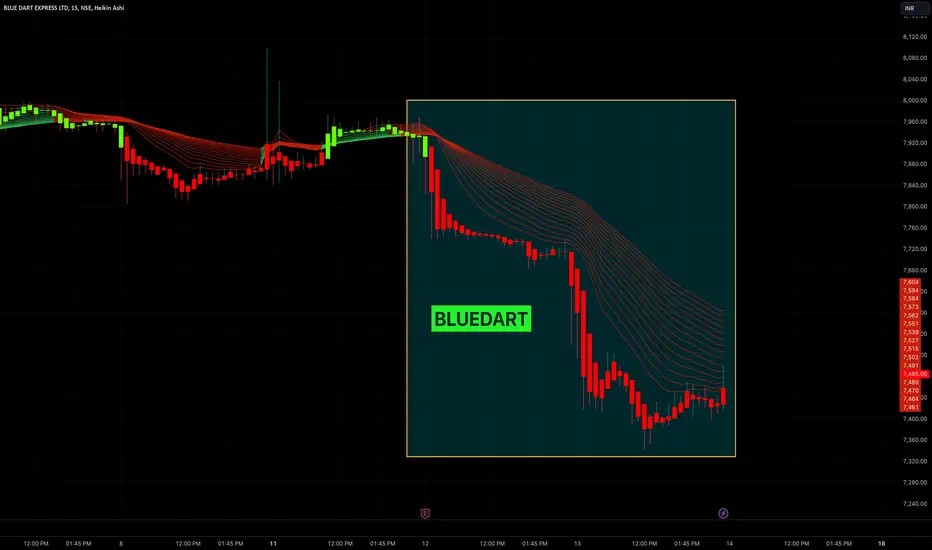
BLUEDART SHORT CAUGHT!Today was a one side, short market!
I always believe in following the money - the smart money!
Coupled with the options Weekly contracts termination like BANKNIFTY, MIDCPNIFTY, FINNIFTY, etc, we are going to see more sell off in this week, as per my observation.
Dont go LONG in the market blindly tomorrow ( 14, Nov, 2024).
Good luck and Namaste!
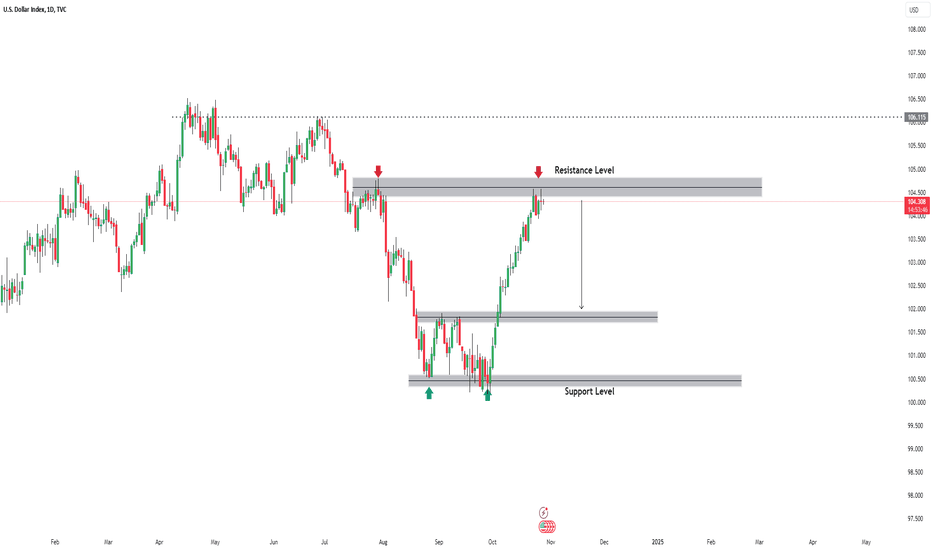
DXY (US Dollar Index) Analysis Daily TimeframeDXY is currently sitting at a daily resistance level after a bullish run since last week.
we anticipate a potential move to the downside as the index shows signs of weakening, by creating a Doji candlestick, which indicates market indecision.
Remember: If the US Dollar Index turns bearish, EUR/USD and GBP/USD are likely to show bullish momentum.
Let's take a closer look at these pairs for potential buy setups.
EURUSD sellEur vs Us dollar we expecting a pull back to Daily Resistance trendline and as we are putting our idea EUR vs US dollar having a bull run over to its trendline we are expecting a rejection from there and a Drop to its Support under lying Suppot level remember its a Bearish trend and following its technical data
Bitcoin 20k
**Bitcoin Shark**
(Tune: Baby Shark)
Bitcoin, doo doo doo doo doo doo
Bitcoin Shark!
Buy the dip, doo doo doo doo doo doo
Bitcoin Shark!
To the moon, doo doo doo doo doo doo
Bitcoin Shark!
HODL strong, doo doo doo doo doo doo
HODL strong, doo doo doo doo doo
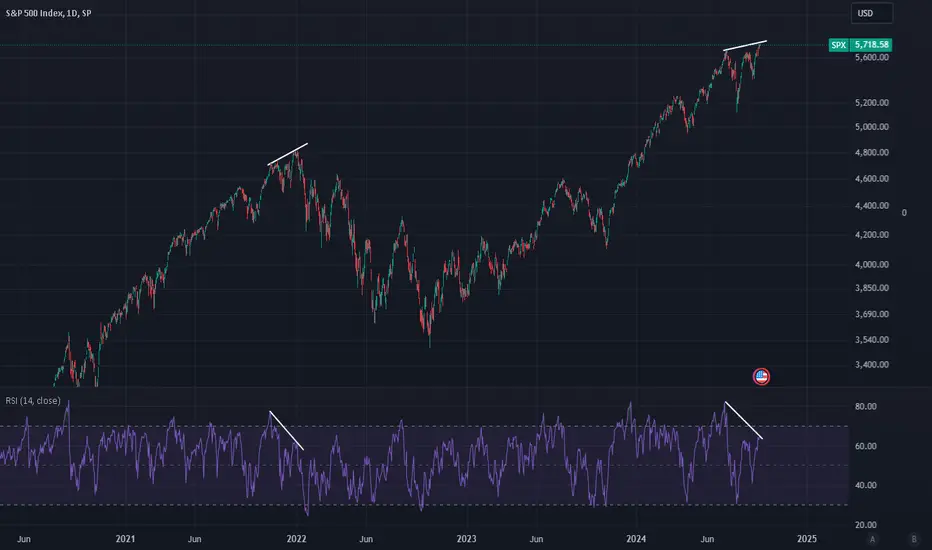
Major Top Forming on SPXHello Everyone, a simple analysis of the RSI and current price action appear eerily similar to the 2022 peak. During the 2022 top we had financial experts and the media claiming victory stating that this bull market will continue, however we crashed soon after. Now the SPX is currently forming a topping process, this could be done or we could go a little higher before the bear market continues. It's clear that the SPX is making new highs while NDX and IWM fail to make a new high suggesting that
Second Chance Shorting Opportunity on EURUSDIf you’re looking for a second chance to short EURUSD, there’s a promising setup involving a Type 2 Bearish Shark Pattern with RSI Divergence. Let’s break it down.
Current Overview:
- Type 2 Bearish Shark Pattern:
- What It Means: The first target has already been achieved. This provides clarity on the first target but might reduce participation since the initial group of traders who profited may not re-engage.
- RSI Divergence:
- Signal: This divergence adds another layer of confirm
Second Attempt at Shorting NZDUSDI’m back at it with a second attempt to short NZDUSD, and here’s why this setup caught my attention.
Current Overview:
- 4-Hourly Chart:
i) Rising Channel: The pair is moving within a rising channel.
ii) RSI Divergence: This divergence signals a potential weakening of the uptrend, which adds confidence to the short setup.
Shorting Opportunity:
- 1-Hourly Chart:
i) Type 2 Bearish Shark Pattern: This pattern gave me a solid entry at 0.6029.
Strategy:
- 1st Target:
i) Extended
Trading Idea: Bearish Shark Setup on NZDUSDI wanted to share an interesting setup on NZDUSD that’s been forming for a while. Let’s dive into the details!
Current Overview:
Bearish Shark Setup:
Potential Reversal Zone (PRZ) : The setup has been hovering at the PRZ, which some traders might misinterpret as a violation.
Key Insights:
Having the Right Knowledge Matters : From my 19 years of trading and nearly 16 years of coaching, I’ve seen even experienced traders make mistakes in reading signals like this. It’s not uncommon for t