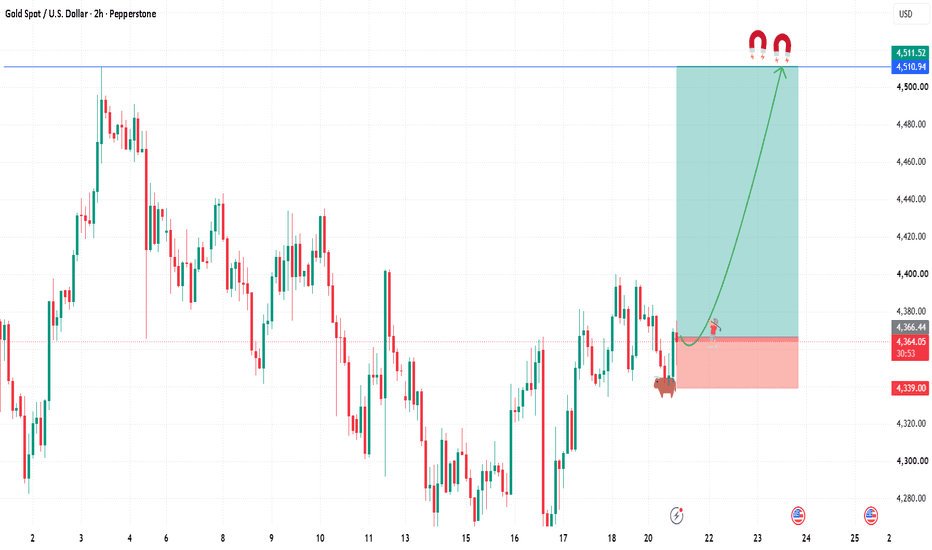
Time to collect ProfitHello Traders!
There are strong bullish patterns at recent highs and now it has formed a small pattern with bearish breakout but it wont be able to push it more downside as market is about to reverse and bullish pattern are waiting for this pair to reach recent highs.
We are buying Collectusdt from 0.0436
Stoploss 0.04156(-4.7%)
Target 0.04718(+8%)
My goal is to be recognized as one of the highest win-rate traders in the TradingView community. :)
Trade Analysis Based on
> Fibonacci Tool (A1000x Way) – Custom Fibonacci approach for precise market analysis
> Candlestick Patterns – Strong price action confirmation through key candle formations
> A1000x Breakout Strategy – Identifying and trading high-probability breakout setups
> HH, HL & LH, LL Strategy – Market structure analysis for clear trend direction
> Swing Points – Tracking key highs and lows for accurate price movement insight
> A1000x Stoploss Strategy – Strategic stoploss placement for effective risk control
> A1000x Target Strategy – Structured target setting based on price action
We trade using carefully developed strategies and disciplined market analysis, always seeking the best possible accuracy while remembering that ultimate success comes only by the will of Allah.
In some trades, you may notice a relatively larger stop loss or a risk-to-reward ratio that may appear unusual at first glance. However, every trade is taken with proper planning and calculated analysis, not random entries.
Before entering any position, we perform detailed calculations and market evaluation. Based on this analysis, we carefully determine our stop loss and target levels.
I personally apply one of my specialized stop-loss and target strategies, designed to place the stop loss at a logical market level where price is less likely to reach before moving toward the intended target — InshaAllah.
Trading always involves risk, but with discipline, patience, and proper strategy, we aim for consistent and responsible decision-making.
Feel free to share your thoughts, leave a comment, or contact me.
Bullish Patterns
WLD - Triple Confluence in FocusWLD has been correcting after its recent bullish impulse and is now approaching a high-confluence support area, where three important technical factors meet. 📊
The current pullback is bringing price toward the intersection of:
• The previous accumulation zone, where buyers previously took control.
• The 0.786 Fibonacci retracement, a level often associated with deep corrections before trend continuation.
• A strong demand zone, where buying interest is expected to increase.
📌 As WLD approaches this triple confluence, we will be looking for trend-following long setups, anticipating the next bullish impulse if buyers successfully defend this area.
As always, we will wait for bullish confirmation before entering any positions rather than trying to catch the exact bottom.
Will this triple confluence trigger the next rally? 🤔
⚠️ Disclaimer: This is not financial advice. Always do your own research and manage risk properly.
📚 Stick to your trading plan regarding entries, risk, and management.
Good luck! 🍀
All Strategies Are Good; If Managed Properly!
~Richard Nasr
NZDCAD - Ascending Triangle Support in FocusNZDCAD has been respecting an ascending triangle pattern for several months, with buyers consistently defending the rising lower trendline while sellers cap the upside near the weekly resistance zone. 📊
The pair is now approaching the lower bound of the ascending triangle, a dynamic support that has already triggered multiple bullish reversals.
📌 As long as this rising trendline continues to hold , we will be looking for trend-following long setups, anticipating another move toward the upper boundary of the range.
As always, we will wait for bullish confirmation before entering any positions rather than trying to catch the exact bottom.
Will the ascending triangle trigger another bullish bounce? 🤔
⚠️ Disclaimer: This is not financial advice. Always do your own research and manage risk properly.
📚 Stick to your trading plan regarding entries, risk, and management.
Good luck! 🍀
All Strategies Are Good; If Managed Properly!
~Richard Nasr
AAPL BEST PLACE TO BUY FROM|LONG
AAPL SIGNAL
Trade Direction: long
Entry Level: 281.28
Target Level: 297.58
Stop Loss: 270.32
RISK PROFILE
Risk level: medium
Suggested risk: 1%
Timeframe: 9h
Disclosure: I am part of Trade Nation's Influencer program and receive a monthly fee for using their TradingView charts in my analysis.
✅LIKE AND COMMENT MY IDEAS✅
Fed Rate Hike Talk Sends USDCAD Toward Key Buy Zone!Hey Traders,
In today's trading session, we are monitoring USDCAD for a potential buying opportunity around the 1.41500 zone. USDCAD is trading in a broader uptrend and is currently in a correction phase, with price approaching the 1.41500 support and resistance area, a key trendline support zone that could provide an attractive opportunity for bullish continuation.
From a fundamental perspective, the U.S. Dollar remains well supported following hawkish comments from former Fed Governor Kevin Warsh, who argued that the Federal Reserve should remain prepared to tighten policy further if inflation fails to ease. His remarks reinforced the market's higher-for-longer interest rate expectations, supporting both Treasury yields and the U.S. Dollar.
Meanwhile, the Canadian Dollar continues to face headwinds as markets assess the outlook for global growth and commodity prices. With the policy outlook favoring continued USD strength, the balance of risks remains skewed to the upside for USDCAD.
With price correcting into the 1.41500 support zone within a broader bullish structure, the current pullback may offer an attractive opportunity for buyers to position in line with the prevailing trend.
As long as price remains above the 1.41500 support zone, the bullish structure remains intact, and we anticipate continuation toward higher resistance levels.
Trade safe,
Joe
EUR/USD BUYERS WILL DOMINATE THE MARKET|LONG
EUR/USD SIGNAL
Trade Direction: long
Entry Level: 1.134
Target Level: 1.139
Stop Loss: 1.130
RISK PROFILE
Risk level: medium
Suggested risk: 1%
Timeframe: 1h
Disclosure: I am part of Trade Nation's Influencer program and receive a monthly fee for using their TradingView charts in my analysis.
✅LIKE AND COMMENT MY IDEAS✅
ETH/USD LONG FROM SUPPORT
ETH/USD SIGNAL
Trade Direction: long
Entry Level: 1,574.73
Target Level: 1,816.87
Stop Loss: 1,413.27
RISK PROFILE
Risk level: medium
Suggested risk: 1%
Timeframe: 9h
Disclosure: I am part of Trade Nation's Influencer program and receive a monthly fee for using their TradingView charts in my analysis.
✅LIKE AND COMMENT MY IDEAS✅
AUD/CAD BULLS WILL DOMINATE THE MARKET|LONG
Hello, Friends!
It makes sense for us to go long on AUD/CAD right now from the support line below with the target of 0.980 because of the confluence of the two strong factors which are the general uptrend on the previous 1W candle and the oversold situation on the lower TF determined by it’s proximity to the lower BB band.
Disclosure: I am part of Trade Nation's Influencer program and receive a monthly fee for using their TradingView charts in my analysis.
✅LIKE AND COMMENT MY IDEAS✅
BITCOIN BUYERS WILL DOMINATE THE MARKET|LONG
BITCOIN SIGNAL
Trade Direction: long
Entry Level: 59,209.36
Target Level: 60,408.39
Stop Loss: 58,410.01
RISK PROFILE
Risk level: medium
Suggested risk: 1%
Timeframe: 1h
Disclosure: I am part of Trade Nation's Influencer program and receive a monthly fee for using their TradingView charts in my analysis.
✅LIKE AND COMMENT MY IDEAS✅
SOL - Is History Repeating Itself?SOL has been following a price cycle that looks remarkably similar to its previous major market cycle. While history never repeats perfectly, it often rhymes, making historical comparisons a valuable tool for understanding where we may be in the current market structure. 📊
In the previous cycle, SOL completed an 8-leg corrective sequence before finally reaching its ultimate bottom. That final Leg 8 produced one last lower low inside the accumulation zone before buyers stepped in and started the next major bullish trend.
📌 If this cycle continues to follow a similar path, SOL now appears to be approaching Leg 8 once again. This suggests that one final lower low could still be ahead before a long-term bottom is established.
That does not mean the market must follow the exact same path. Instead, it gives us a roadmap of what to watch for over the coming weeks.
For now, I remain focused on monitoring price action around the accumulation zone. If history continues to rhyme, this area could eventually offer one of the best long-term opportunities of the cycle.
Will SOL complete one final leg before the next bull run begins? 🤔
⚠️ Disclaimer: This is not financial advice. Always do your own research and manage risk properly.
📚 Stick to your trading plan regarding entries, risk, and management.
Good luck! 🍀
All Strategies Are Good; If Managed Properly!
~Richard Nasr
GBP/CHF BULLISH BIAS RIGHT NOW| LONG
Hello, Friends!
GBP/CHF pair is in the uptrend because previous week’s candle is green, while the price is evidently falling on the 4H timeframe. And after the retest of the support line below I believe we will see a move up towards the target above at 1.071 because the pair is oversold due to its proximity to the lower BB band and a bullish correction is likely.
Disclosure: I am part of Trade Nation's Influencer program and receive a monthly fee for using their TradingView charts in my analysis.
✅LIKE AND COMMENT MY IDEAS✅
AUDCAD - Range Support in FocusAUDCAD has been trading within a well-defined range for the past few months, with buyers consistently stepping in around the lower boundary and sellers defending the upper boundary. 📊
The pair is now once again retesting the lower bound of this range, an area that has repeatedly acted as strong support.
📌 As long as this support zone continues to hold, we will be looking for trend-following long setups, anticipating another move toward the upper boundary of the range.
As always, patience is key. Rather than buying immediately, we will wait for bullish confirmation before considering any long positions.
Will the lower bound hold once again and trigger another rally? 🤔
⚠️ Disclaimer: This is not financial advice. Always do your own research and manage risk properly.
📚 Stick to your trading plan regarding entries, risk, and management.
Good luck! 🍀
All Strategies Are Good; If Managed Properly!
~Richard Nasr
NASDAQ Buy Opportunity as Seasonal Strength Returns!Hey Traders,
In today's trading session, we are monitoring NASDAQ (NAS100) for a potential buying opportunity around the 28,800 zone. NAS100 is trading in a strong uptrend and is currently in a correction phase, with price approaching the 28,800 support and resistance area, which aligns with a key trendline support zone.
From a fundamental perspective, the broader trend in U.S. equities remains constructive despite recent volatility. Investor sentiment continues to be supported by resilient economic data, solid corporate earnings, and ongoing demand for AI and technology-related stocks. While higher interest rate expectations have created short-term pullbacks, buyers have consistently stepped in during corrections.
From a seasonal standpoint, this period has historically been favorable for the Nasdaq, with strong institutional inflows often supporting technology stocks during this time of the year. As long as macro conditions remain stable, the broader bullish trend remains intact.
With price correcting into the 28,800 support zone, the current pullback may provide an attractive opportunity for buyers looking to trade in the direction of the prevailing trend.
As long as price remains above the 28,800 support zone, the bullish structure remains intact, and we anticipate continuation toward higher resistance levels.
Trade safe,
Joe
Gold At Support, Bullish Reversal ? Gold is currently trading at a significant higher-timeframe support zone, positioning price at a technically important area where buyers may begin to regain control. This macro support aligns with the Value Area Low (VAL) of the current trading range, creating a strong area of confluence that often attracts increased market participation. Rather than an immediate reversal, this type of location typically encourages a period of consolidation before the next directional move develops.
With price now trading in this support region, the probability of a local bottom forming is beginning to increase. Gold has also entered oversold territory, suggesting that bearish momentum may be becoming exhausted. While oversold conditions alone do not guarantee a reversal, they frequently precede relief rallies when combined with major technical support.
As long as gold continues to hold above the $4,000 support level, the broader trading range remains intact. Maintaining this level keeps the probability elevated for a rotational move higher toward the next major resistance at $4,500. That resistance represents the upper boundary of the current range and is the primary upside objective if buyers successfully defend current prices.
From a technical perspective, gold is trading from a favorable reaction zone. The combination of macro support, the Value Area Low, and oversold conditions suggests that consolidation is likely before a recovery begins. If buyers establish a higher low above $4,000, the probability favors an oversold bounce and a rotation back toward the $4,500 resistance area.
Silver Ready to Bounce, Bullish Price Silver is currently trading at a major technical support zone, where several high-probability signals are aligning. Price has retraced into a daily support level that is in technical confluence with the 0.618 Fibonacci retracement and the Value Area Low (VAL) of the current trading range. This combination creates a strong area of demand where buyers may begin stepping back into the market.
Adding to the bullish case, silver is showing extremely oversold conditions, increasing the likelihood of a relief rally from current prices. While oversold markets can remain weak for longer than expected, they often produce sharp recovery moves once selling pressure begins to fade. As long as price continues to hold above the current support region, the probability favors an oversold bounce toward higher resistance.
The first major upside objective is the $70 level, which represents the upper boundary of the current trading range and an area where sellers may look to regain control. A move into this region would complete a rotational rally within the broader range between $67 and $70.
From a technical perspective, silver remains in a favorable location for buyers. The convergence of daily support, the 0.618 Fibonacci retracement, and the Value Area Low provides a strong foundation for a potential reversal. As long as these support levels continue to hold, the immediate outlook favors a recovery toward resistance before the market determines its next major directional move.
Gold Outlook and trade setup for 26-06-2026Gold is taking support of 3960 and has shown multiple rejection from going down, It has already consolidated for about 2 trading sessions, and withing that consolidating range price is already following a rising trendline, hence it's safe to expect a breakout above the bearish trendline, and above the level of 4045, if price gives a clean breakout then we can consider taking longs trade, with an appropriate SL, as of now 3980 seems like a good Stoploss level.
summary: Wait for breakout for fresh entries. Cautious selling.
For Educational Purposes only, Not an Investment Advice, Always use strict Risk management measures.
Regards CrazyTrades247.
CAKE Holding Key Support — Potential Bounce Toward Recent HighsCAKE is sitting on an important support area.
If buyers continue to defend this level, CAKE could benefit from renewed capital rotation into the BNB ecosystem.
A successful hold above support, combined with improving risk appetite, could open the door for a move back toward the recent highs.
Trade Setup:
Entry Zone: $1.30 – $1.32
Take Profit: $1.38 / $1.43
Stop Loss: $1.28
Gold (XAUUSD): Wave IV Correction Nearing Late StageGold made a strong extension higher over the last couple of years, which we interpret as wave III of an ongoing five-wave bullish impulse. This impulsive structure reflects strong trend participation and sustained institutional demand during the advance. Despite the slowdown into 2026 and a break below the 4000 level, the weekly timeframe still suggests that price action is correcting within a broader wave IV rather than transitioning into a completed bearish cycle.
Current price behavior remains consistent with a complex corrective phase, where volatility increases and directional clarity temporarily fades after a strong impulsive leg.
From a higher-degree perspective, gold remains in a wave four correction that may gradually complete later this year. Key long-term support is still seen in the 3900–3200 zone, where a more meaningful reaction or potential structural low could develop once the correction matures.
NEAR - Triple Confluence Support AheadNEAR remains bullish from a broader market perspective, and the current decline appears to be a correction within that larger uptrend. 📈
As price continues to pull back, it is approaching a high-confluence support area where three strong technical factors intersect:
🔹 The lower bound of the falling red channel, representing the current corrective structure.
🔹 The rising blue trendline, acting as dynamic non-horizontal support.
🔹 The green demand zone, where buyers have previously stepped in aggressively.
When multiple technical support levels align at the same location, they often create high-probability reaction zones.
📌 As long as this triple confluence holds, we will be looking for trend-following long setups, anticipating that the correction may come to an end and the primary bullish trend resumes.
As always, we will wait for proper bullish confirmation before entering any position.
Will NEAR bounce from this triple confluence and continue its uptrend? 🤔
⚠️ Disclaimer: This is not financial advice. Always do your own research and manage risk properly.
📚 Stick to your trading plan regarding entries, risk, and management.
Good luck! 🍀
All Strategies Are Good; If Managed Properly!
~Richard Nasr
AUD/USD BULLS WILL DOMINATE THE MARKET|LONG
Hello, Friends!
We are targeting the 0.694 level area with our long trade on AUD/USD which is based on the fact that the pair is oversold on the BB band scale and is also approaching a support line below thus going us a good entry option.
Disclosure: I am part of Trade Nation's Influencer program and receive a monthly fee for using their TradingView charts in my analysis.
✅LIKE AND COMMENT MY IDEAS✅
Gold Outlook for the day 25-06-2026
Outlook for the day: Bearish to sideways
Wait for the breakout for new entries, for fresh short entries observe caution.
Overview:
After a good correction of 2.7% that we saw yesterday, Price is consolidating in a narrow range of 4022 - 3960. where range's high and low is acting as immediate support and resistance. In last 5 trading sessions price has declined more than 10%, following to which a pull back is reasonable to expected. But we should wait for clean breakouts before initiating any entries, for entries on the long side, level of 4042 can act as confirmation.
For today, pullback trades would be highly preferable.
For Educational Purposes only, Not an Investment Advice, Always use strict Risk management measures.
Regards CrazyTrades247.
USDCAD beginning of a bull run above 1.400?A major bullish trendline is intact since July 2011, price has bounced back multiple times, after testing it's significance, support zone-1 is acting as a strong demand zone, form which price has shown significant bounces many times, most recent bounce-back as marked by green arrow has taken the support of the confluence of zone-1 & rising trendline as marked by green arrow.
Price has given a breakout above the Bearish trendline, that has worked as a wonderful rejection level since 1.5 years, rejections are marked by red arrows. We are now expecting a pullback that can retest the bearish trendline.
On the upside 1.3967 is an important level on the structure, breakout of which, can lead to the beginning of a new rally, supported by nice price structure.
However waiting for the breakout of 1.4, can be a good idea, as 1.4 is a strong psychological level
Our case for USDCAD case is even supported by the technical structure on DXY (Do Check out the related publications on DXY)
Any new perspective you want to add, Please feel free to mention below in the comment.
For Educational Purposes only, Not an Investment Advice.
Regards CrazyTrades247.
SILVER BULLS ARE GAINING STRENGTH|LONG
Hello, Friends!
SILVER is making a bearish pullback on the 4H TF and is nearing the support line below while we are generally bullish biased on the pair due to our previous 1W candle analysis, thus making a trend-following long a good option for us with the target being the 6,372.4 level.
Disclosure: I am part of Trade Nation's Influencer program and receive a monthly fee for using their TradingView charts in my analysis.
✅LIKE AND COMMENT MY IDEAS✅