Datadog (DDOG) — Strong Growth, but Is the Valuation Justified?Datadog is a leading cloud observability and security platform, benefiting from the structural growth of cloud computing, artificial intelligence, and increasingly complex IT infrastructure.
However, a strong business does not necessarily make a stock an attractive investment at any price.
1. BUSINESS MODEL AND COMPETITIVE ADVANTAGES
Datadog provides a unified platform covering infrastructure monitoring, application performance monitoring (APM), log management, cloud security, and digital exp
Bullish Flag
AUDUSD 15M: 15 Trades, 11 Wins — Ryan-Trend Pulse I've been testing Ryan-Trend Pulse on AUDUSD using the 15-minute timeframe, combining indicator signals with the 200 EMA trend filter.
The results so far:
📈 Performance Snapshot
✅ Winning trades: 11
❌ Losing trades: 4
📊 Total trades: 15
⚙️ The Strategy
1. 200 EMA — Identify the Trend
🟢 Long: Price breaks above the 200 EMA.
🔴 Short: Price breaks below the 200 EMA.
2. Ryan-Trend Pulse — Confirm the Entry
Wait for the first valid indicator signal after the EMA breakout, ideally
Jacobs is signaling a Bull Flag on the WeeklyNYSE:J is coiling in a tight bull flag on the weekly after a strong pole from about 106 to 153 (May–Aug).
The setup:
• Entry: weekly close / breakout above 140.41. A more conservative trigger is a daily close above 144.35.
• Stop: 134.23, below the flag lows
• Target: 188.03, the measured move from the pole
• Risk/reward: about 7.6:1 from entry
Price is holding the 50 and 200 averages while the flag tightens. Watch for volume expanding on the breakout.
Risks: Earnings are 11/19, so manage size
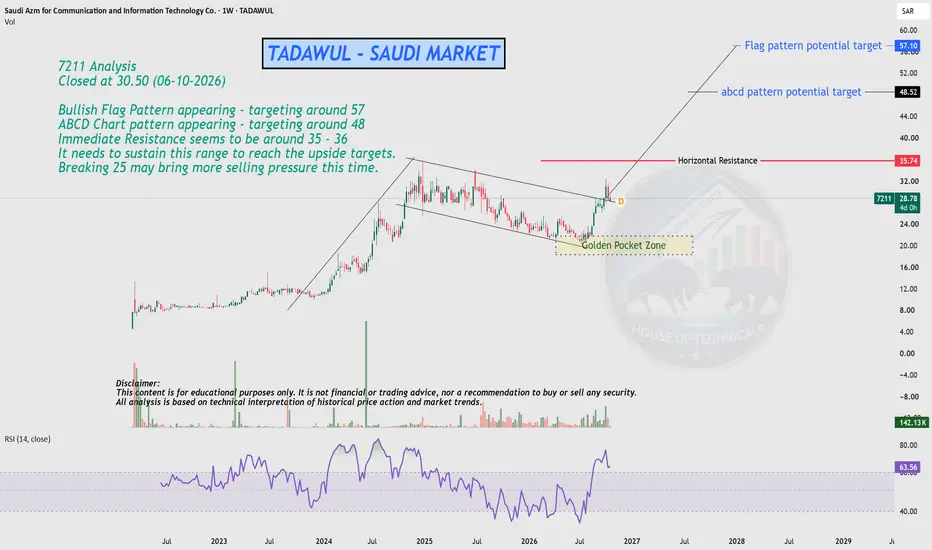
Bullish Setup in 72117211 Analysis
Closed at 30.50 (06-10-2026)
Bullish Flag Pattern appearing - targeting around 57
ABCD Chart pattern appearing - targeting around 48
Immediate Resistance seems to be around 35 - 36
It needs to sustain this range to reach the upside targets.
Breaking 25 may bring more selling pressure this time.
Could this be a Bullish Flag?After the 5 day rally that started on September 17, BTCUSD has been correcting for almost a month now and playing within this channel.
Could it be a bullish flag that we would eventually break out of to the upside like the one we apparently broke out of on September 3?
Or is BTCUSD likely to continue playing within this channel?
ATM, I would watch the price action around the boundaries of the range for scalps.
USDCHF 15M: Capturing the Bullish Move with Ryan-Trend PulseUSDCHF delivered a strong bullish move after breaking above the 200 EMA, creating a profitable long opportunity before the market eventually reversed and pulled back.
📊 1. Trend Confirmation — 200 EMA
Price broke above the 200 EMA, shifting the short-term market bias from bearish to bullish. The rising EMA provided additional confirmation of the developing uptrend.
🟢 2. Ryan-Trend Pulse Entry
After identifying the bullish direction, Ryan-Trend Pulse provided a structured long setup aroun
XAUUSD 15M: Catching the Gold Rally with Ryan-Trend PulseGold provided a strong bullish opportunity after breaking above the 200 EMA, followed by a powerful upward move. This setup demonstrates how Ryan-Trend Pulse can help identify trend-following entries with predefined trade levels.
📊 1. Identify the Trend — 200 EMA
Price moved above the 200 EMA, shifting the market bias toward bullish momentum. Instead of entering immediately, we waited for confirmation from Ryan-Trend Pulse.
🟢 2. Ryan-Trend Pulse Entry
The indicator provided a long setup
Silver (XAGUSD) –Bullish Flag Continuation SetupSilver is currently developing a Bullish Flag continuation pattern following a strong impulsive recovery from its July 2026 lows. After reaching its all-time high in January 2026, the metal entered a prolonged corrective phase, declining nearly 55% before signs of accumulation began to emerge. The first major indication of a potential trend reversal appeared in July 2026, when Silver formed a bullish RSI divergence on the Daily timeframe, signaling weakening bearish momentum despite lower prices
EURUSD 15M: From Uptrend to Downtrend with Ryan-Trend PulseEURUSD provided an example of market transition from an uptrend to a downtrend , creating profitable opportunities in both directions using the same strategy.
The key is not to predict the reversal — it's to wait for the 200 EMA breakout and Ryan-Trend Pulse confirmation .
📈 The Strategy
1. 200 EMA — Determine Market Direction
The 200 EMA acts as the primary trend filter:
🟢 Long: Price breaks above the 200 EMA
🔴 Short: Price breaks below the 200 EMA
2. Ryan-Trend Pulse — Confirm the
XRP Looks ready for $1.93The current symmetrical bull pennant priceaction is at the apex of seems likely to break upward. The current candle is slightly above the top trendline, and the stochrsi is just now climbing back out of the oversold zone with plenty of room to move upward. We also have the bullish confluence of the fact that both the current pennant and the bullflag we broke up from a week or few back have the exact same measured move target right around $1.93/ All good indications that a validated breakout is a
$BTC BULLS ARE IN CONTROL.BULLS ARE IN CONTROL.
CRYPTOCAP:BTC Closes the Week above the May high, 50SMA, 50EMA, STH 90EMA and the .382 Fib
IMO THE LOW IS IN.
I still very much expect a large correction around Midterms tho.
Without me even knowing it at the time, my ₿itcoin cycle analysis from ~2.5 years ago points to the actual day of the midterms Nov. 3rd as the low of that correction.
The simulation is predicting Republicans will lose, and markets will puke from fear followed by a sharp rally, similar to how we
If bitcoin hits full bullflag breakout target it goes to $96919Things have been looking very bullish for bitcoin and crypto indeed ever since the business cycle gave us the bull market continuation signal. Bitcoin has cleared the ever important 83k mark needed to secure the higher high and appears to be on its way to hit the bullflag breakout target now. Must be very vigilant here not to be caught in a bull trap for what whales often like to do is reverse course not long after a higher high is achieved in these kind of set ups. I think it is very likely tha
Sol has broken up from its bullflag. Target= $139.94The original smaller descending channel Sol broke up from ended up not being the full flag and the bigger more valid flag took another week ro 2 to develop but we can see now it has clearly broken upward from the real flag and is beginning to ascend towards the breakout target. * not financial advice*
Amazon ($AMZN) Daily: Corrective Pullback ApproachesAmazon ( NASDAQ:AMZN ) Daily: Corrective Pullback Approaches Crucial 200-EMA & 226 Support Confluence for Bullish Reversal
### 🇺🇸 Amazon.com, Inc. ( NASDAQ:AMZN ) Daily Technical Matrix (Ref: AMZN_2026-09-16_09-30-33.png)
We are issuing an updated Daily (1D) structural study for Amazon.com, Inc. ( NASDAQ:AMZN / NASDAQ). Following a strong rally that reached macro highs near the 286.58 horizontal ceiling, price action has entered a corrective phase. The stock is currently descending toward a hi
The stage is set for xrp to break up from the bullflag Lots of bullish confluence at the moment on XRPUSD’s 1 day chart here. First off we just closed our 1st daily bullish candle above the top trendline of the bullflag. Secondly the stochrsi has been in the fully reset / oversold zone for over a week now and has just now dipped back up into the bullish zone. Thirdly, the golden cross is likely to occur sometime this week and price action is still relatively close to the 200ma which increases the probability of a sustained golden cross. Lastly tomor
BE: Bullish Breakout Above the 50-Day and 200-Day EMAsBloom Energy closed at $275.75 on September 11, 2026, confirming a strong bullish structure on the daily chart.
The stock is trading approximately 18.2% above its 50-day EMA at $233.26 and 39.9% above its 200-day EMA at $197.07. The 50-day EMA remains above the 200-day EMA, while both moving averages support a positive medium-term trend.
BE has also broken above its descending trendline. The latest session ended close to its daily high of $277.28, gaining 6.68% on volume of 13.63 million share
ISRG at a Major Weekly Decision Zone Below the 50 and 200 EMAsISRG is testing a major weekly zone around $355–$395 after a significant correction from its all-time highs.
The highlighted rectangle marks an important structural area. It acted as resistance in 2021–2022 before becoming support during the 2024 breakout. The recent rebound shows that buyers are reacting, but a bullish reversal is not confirmed yet.
Price remains below both the blue 50-week EMA and the orange 200-week EMA. The 50-week EMA is declining, while the 200-week EMA is still acting a
S&P 500 ($SPX) 4H: Price Action Retests Crucial 7,576S&P 500 ( SPCFD:SPX ) 4H: Price Action Retests Crucial 7,576 Support Baseline at Make-or-Break Wedge Confluence
### 🇺🇸 S&P 500 Index ( SPCFD:SPX / SPCFD) 4-Hour (4H) Technical Matrix (Ref: SPX_2026-09-11_08-41-26.png)
We are issuing an intraday 4-Hour (4H) technical update for the S&P 500 Index ( SPCFD:SPX / SPCFD). Following a corrective move off the recent macro high, price action has pulled back to test a key structural decision node, compressing directly along the lower boundary of its lo
EUR/USD ($EURUSD) Daily: Testing 17-EMA & 200-EMA EUR/USD ( OANDA:EURUSD ) Daily: Testing 17-EMA & 200-EMA Confluences as Price Action Reaches Major Pivot Point
### 💶 Euro / U.S. Dollar ( OANDA:EURUSD ) Daily Technical Matrix (Ref: EURUSD_2026-09-08_08-49-57.png)
We are releasing an updated Daily (1D) technical study for EUR/USD ( OANDA:EURUSD / OANDA). Following a recovery leg out of multi-month lows, price action is consolidating near key moving average anchors, establishing a tight decision zone along its ascending trendline guide.
EUR/US
Gold Spot ($XAUUSD) Daily: Testing Key 200-EMA InstitutionalGold Spot ( OANDA:XAUUSD ) Daily: Testing Key 200-EMA Institutional Floor at 4,318 as Price Action Reaches Make-or-Break Confluence
### 🪙 Gold Spot / U.S. Dollar ( OANDA:XAUUSD ) Daily Technical Matrix (Ref: XAUUSD_2026-09-07_08-44-07.png)
We are releasing an updated Daily (1D) technical study for Gold Spot ( OANDA:XAUUSD / OANDA). Following a pull-back off recent local resistance levels, price action has dropped to test a major structural decision node, compressed directly between fast dynami