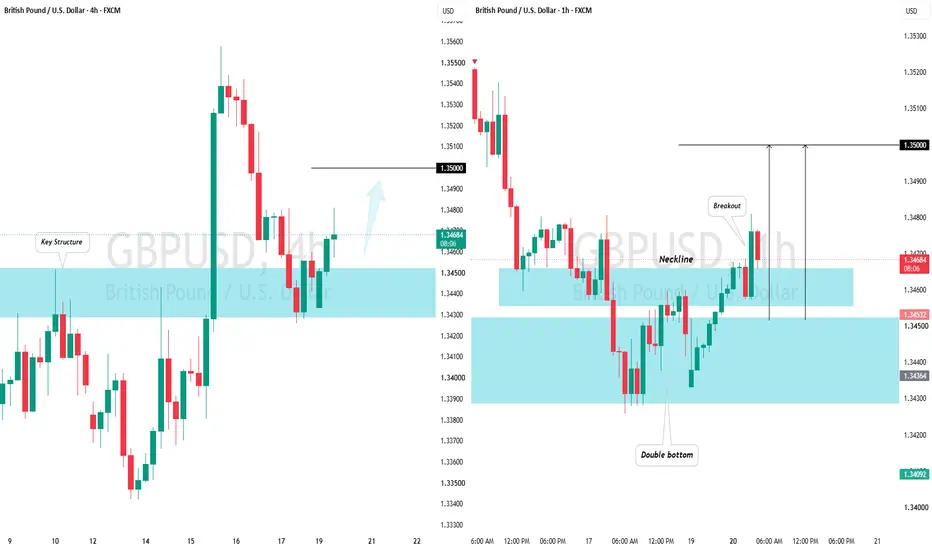
GBPAUD BullishI have GBPAUD bullish today, previously it had a big drop and I believe we will pullback today's trading session. We are currently breaking out the box targeting the order block and the liquidity right above it. We have to go through a couple 4hour zones but as of now, they're not strong enough to hold the bullish movement.
Candlestick Analysis
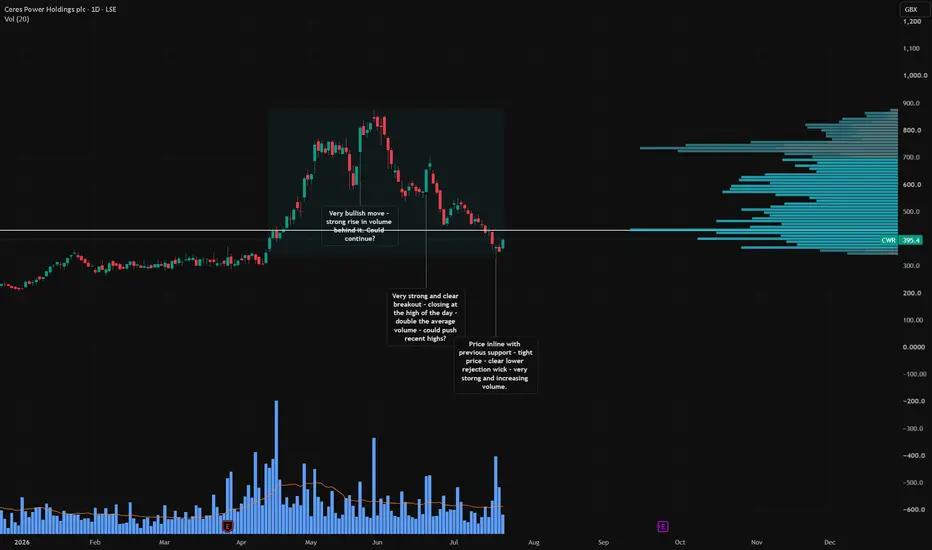
CWR massive volume rejection at support could spark a reboundSimilar setup here with Ceres Power, and this one has historically been a trader’s dream if you were on the right side of the move. Again we now have a price that has fallen into a previous area of resistance. The price itself was very tight between the open and close, but that didn’t stop it pushing lower intraday, only to be rejected on massive volume. This looks like buyers absorbing all of the sell orders and holding the price firm.
It may consolidate a little further yet, but could this trade its way back to the previous highs?
Price target: 839p
Potential reward: a whopping 124% from here
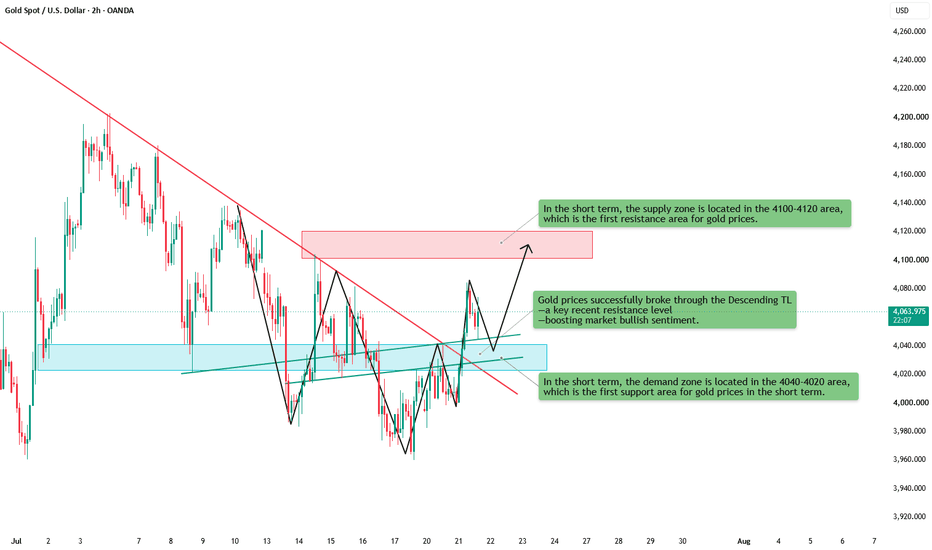
XAUUSD - Gold breakout alert! Can bulls reclaim 4200?Gold prices rebounded strongly today, breaking through the downtrend line—the key resistance zone of 4020-4040—preliminarily confirming the bullish breakout and boosting market confidence. Gold may still have some room for further upward movement.
After the upward breakout, the 4040-4020 area, which was the upper edge of the hourly downtrend channel, has shifted from resistance to support, forming an important short-term defense line for the bulls.
However, it's worth noting that while the bulls have achieved a significant breakthrough, the market is not entirely bullish. The bulls and bears are still fiercely battling it out. In the short term, the 4100-4120 area will be the primary resistance zone, followed by the 4160-4180 area.
Trading Logic:
Since gold bulls have made a significant breakthrough in the short term, gold prices may have some sustainability. Therefore, we can wait for a pullback in gold prices before going long, but we must be cautious about chasing the price directly at a high point.
Trading Strategy:
Primary strategy: Entry - Focus on the 4045-4025 range, with a bullish bias.
Alternative Strategy: Entry - Focus on the 4090-4110range,with a bearish bias.
The above is not investment advice, but for learning and discussion purposes only!
EURCAD SHORTSMarket structure bearish on HTFs 3
Entry at both Weekly And Daily AOi
Weekly Rejection at AOi
Daily Rejection At AOi
Previous Daily Structure Point
Around Psychological Level 1.60500
H4 Candlestick rejection
Rejection from Previous structure
TP: WHO KNOWS!
Entry 105% TPT 120%
REMEMBER : Trading is a Game Of Probability
: Manage Your Risk
: Be Patient
: Every Moment Is Unique
: Rinse, Wash, Repeat!
: Christ is King
GBPUSD LONGMarket structure bullish on HTFs 3
Entry at both Weekly and Daily AOi
Weekly Rejection at AOi
Previous Weekly Structure Point
Daily Rejection at AOi
Previous Daily Structure Point
Daily EMA retest
Around Psychological Level 1.34000
Touching EMA H4
H4 Candlestick rejection
Rejection from Previous structure
TP: WHO KNOWS!
Entry 125% TPT 140%
REMEMBER : Trading is a Game Of Probability
: Manage Your Risk
: Be Patient
: Every Moment Is Unique
: Rinse, Wash, Repeat!
: Christ is King
Canadian Dollar Stuck Between Tariffs and OilUSD/CAD traded with a firmer tone on Tuesday as the Canadian Dollar remained under pressure from the latest U.S. tariff escalation. The U.S. imposed a 50% tariff on a range of Canadian goods tied to disputes over cars, alcohol, and dairy, which immediately complicates Canada’s trade outlook. Normally, elevated oil prices would give the Canadian Dollar a cleaner tailwind, but tariff risk and weaker domestic momentum are making that support less powerful.
For the BOC, the rate path remains a hold story. The central bank kept rates at 2.25% last week and continues to balance elevated inflation against soft growth and trade uncertainty. Canadian inflation already surprised to the downside this week and is expected to ease if oil and gasoline pressures fade, but that forecast now sits against a more complicated trade backdrop. The Canadian Dollar is stuck between two forces: oil supporting Canada’s terms of trade and tariff risk undermining confidence in the growth outlook.
In the above chart, USD/CAD has found follow through in recent weeks after finally breaking out of a multiyear triangle that originated in 2023. In June it was noted that “the first hurdle to validate the bullish breakout is the band of resistance formed by the highs in January, March, and April of this year around 1.3929/66. Through these levels, USD/CAD may have offered the strongest confirmation yet that the near three-year triangle has ceded way to a new bullish trading regime.” Along these lines, USD/CAD’s recent turn higher through its 50-day EMA (exponential moving average) ahead of 1.3929/66 suggests that a series of higher highs and higher lows is emerging. The low carved out by the bullish engulfing bar on July 20 just above 1.4000 may be respected as a turning point in the near-term. That said, a resolution of the fundamental disputes, particularly on tariffs, could override this technical turning point and shift the near-term focus back to the downside.
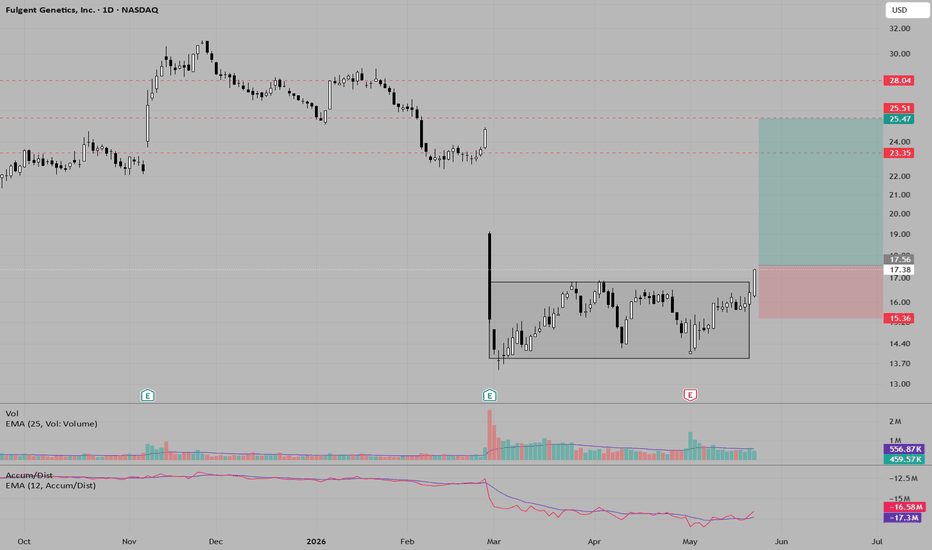
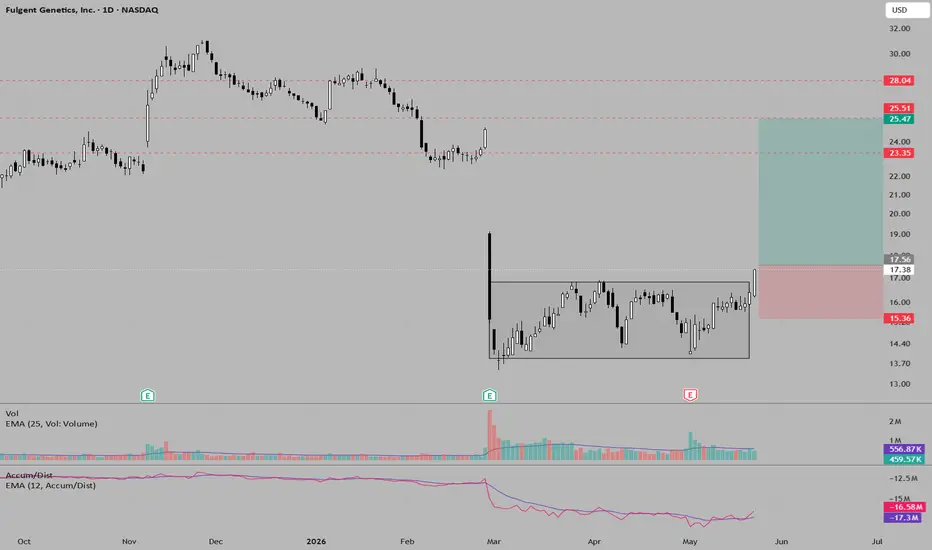
Position Trade 2: FLGTLet's try again, this setup looks better than my previous one: FLGT did a breakout yesterday after staying in a bottom for almost 3 months. The indicated platform looks like a buy zone where the institutions were accumulating, we see a pretty flat A/D (with a few anomalies) and above average volume between 05-01 and 05-08 with price staying in range. ChiOsc and MFI both crossed above 0 recently. This all looks pretty good. Institutional holdings are about 68% according to Nasdaq, this is ok but above 70-80% would be better.
Setup as follows:
Entry: Pop out of the box after bottom completion
Order Stop 17.65, Limit 18.03, GTC
SL: ~Consolidation low, 15.36
TP: ~January Low 25.5
Status: Pending
We only want to enter if yesterday's spike was an anomaly that's why we use a stop limit order to avoid being trapped. Be cautious: Analyst ratings of this stocks are not that good (Piper Sandler downgraded to $15) and the company is still in loss, but revenue is growing since the post covid decline, the company seems to be recovering. Sector is healthcare which is currently gaining strength.
NZDUSD: Bearish Move After Trap 🇳🇿🇺🇸
NZDUSD will likely continue falling after a valid bull trap above a strong intraday resistance.
I expect a bearish movement to 0.584 level.
❤️Please, support my work with like, thank you!❤️
I am part of Trade Nation's Influencer program and receive a monthly fee for using their TradingView charts in my analysis.
S&P500 INDEX (US/500): Your Trading Plan ExplainedThe ⚠️S&P500 index is currently testing a horizontal structure that was recently breached. It is highly probable that this level has now become support.
For a confirmed buying opportunity, please observe the formation of a double bottom pattern on the 4-hour chart.
Should the price break and close above 7521, this would provide strong bullish confirmation.
In such a scenario, the market is anticipated to advance to at least the 7584 level.
Conversely, if the price declines and establishes a new lower low, this trading setup would no longer be valid.
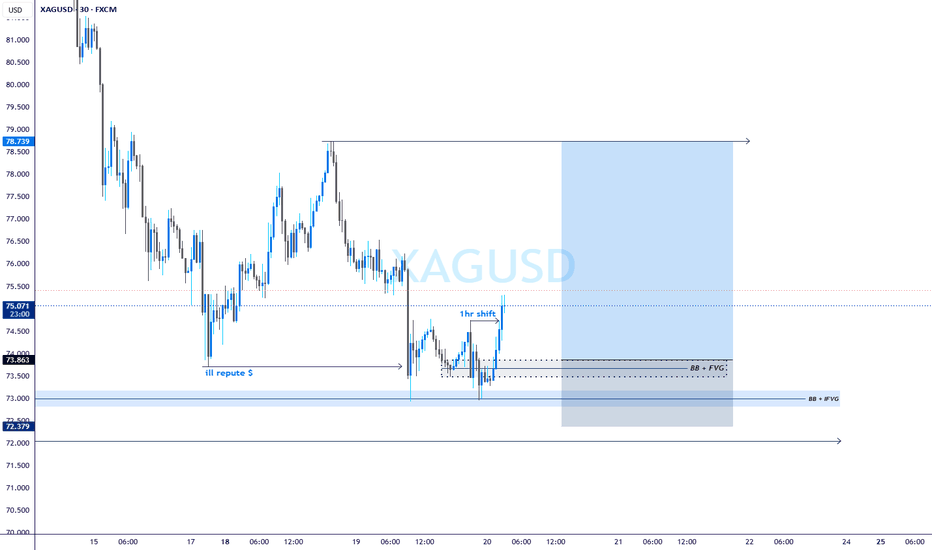
XAGUSD — Liquidity Sweep + Structural Shift | Long Bias ActiveWhat Happened:
Price engineered a sweep of the sell-side liquidity pool (ill repute zone) around the 73.50–73.63 region, tapping directly into a Balanced Price Range + Inverse FVG confluence — a high-probability reaction area.
This wasn't a random bounce. The move below the prior lows was designed to trigger stop orders and induce shorts before reversing. Classic liquidity engineering.
Structural Confirmation:
Following the sweep, price delivered a 1H Change of Character (CHoCH) — closing above 74.732, shifting short-term structure from bearish to bullish on the 1H.
This is the trigger I was waiting for before considering any long exposure.
Current Plan:
Now dropping to the 15M/5M for entry refinement — looking for:
A pullback into the 15M OB or FVG
Lower timeframe BOS or CHoCH to confirm entry
Tight stop positioned below the reaction low (~73.00 BB+IFVG)
Target zone: 78.50 – 78.739 (prior distribution range / next draw on liquidity)
Estimated R:R: 1:3+ depending on entry precision
Invalidation:
Structure fails if price closes back below 73.00 on the 1H. That level remains the last line — a breach reopens the PRO low (~72.00) as the next target.
Bias: Bullish (conditional on LTF entry confirmation)
Status: Pending entry — setup developing
⚠️ Disclaimer: This analysis is for educational purposes only and does not constitute financial advice. Trading leveraged instruments such as commodities and forex carries significant risk and may not be suitable for all investors. Past performance is not indicative of future results. Always conduct your own research and consult a licensed financial advisor before making any trading decisions. I am not responsible for any gains or losses resulting from the use of this analysis.
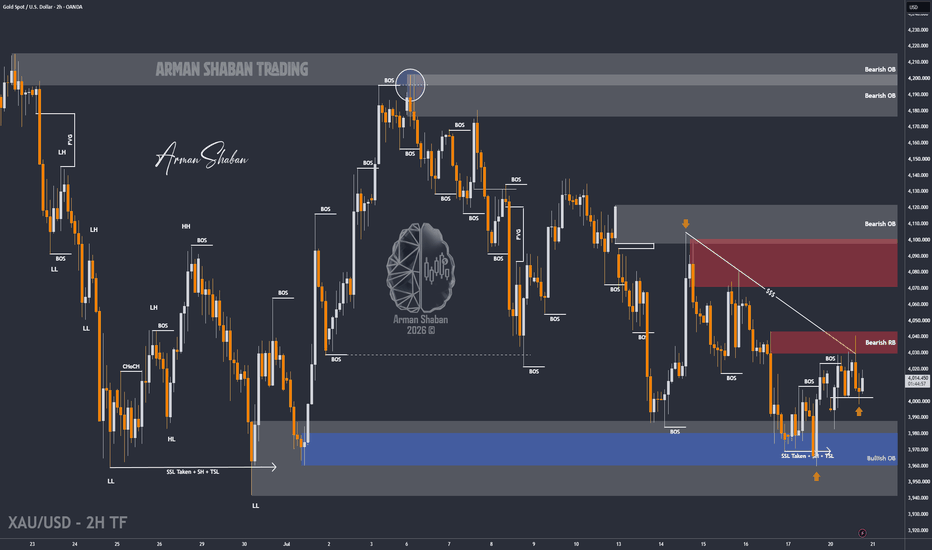
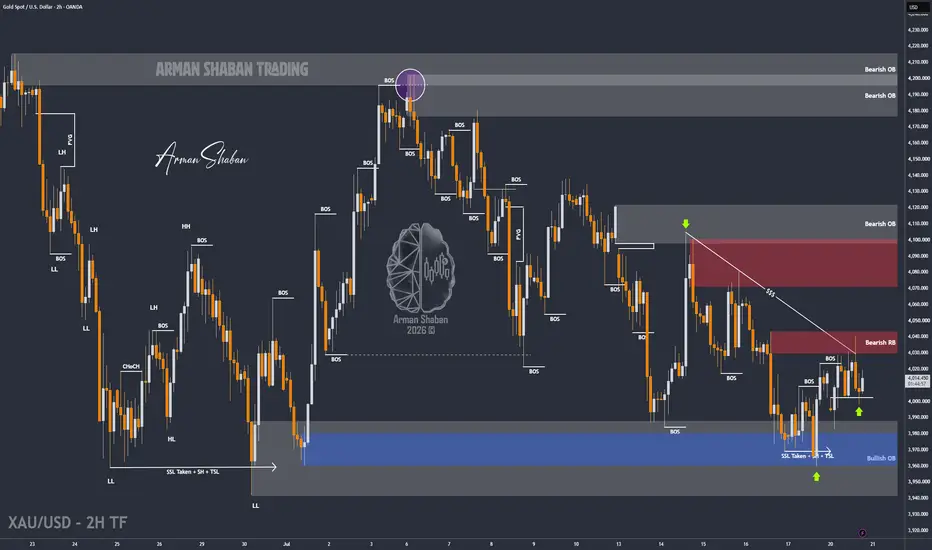
XAU/USD | More Fall Ahead ? (READ THE CAPTION)By analyzing the #Gold chart on the 2H timeframe, we can see that after the previous update, price first dropped toward $3959 and swept the liquidity resting below $3969.
After this liquidity sweep, buyers stepped in and pushed Gold higher toward the important $4040 supply zone. Once price reached this area, sellers became active again and pushed Gold back down toward $3999.
Currently, Gold is trading around $4020. In my view, this bullish move is more likely to remain a temporary correction rather than the beginning of a larger recovery.
The nearest supply zones are located around $4023 – $4040, followed by the stronger resistance area between $4060 – $4080. On the downside, the closest demand zones are around $3990 – $4000, followed by $3958 – $3970 and deeper support between $3935 – $3950.
I still expect another stronger bearish wave to begin soon. A clear stabilization below the psychological $4000 level would increase the probability of further downside toward the lower demand and liquidity zones.
Gold’s recent price action has become extremely unstable and difficult to trade. However, our approach remains unchanged: focus on the important levels, manage risk properly, and always use a clear stop-loss. For now, my main bias remains bearish.
Please support me with your likes and comments to motivate me to share more analysis with you and share your opinion about the possible trend of this chart with me !
Best Regards , Arman Shaban
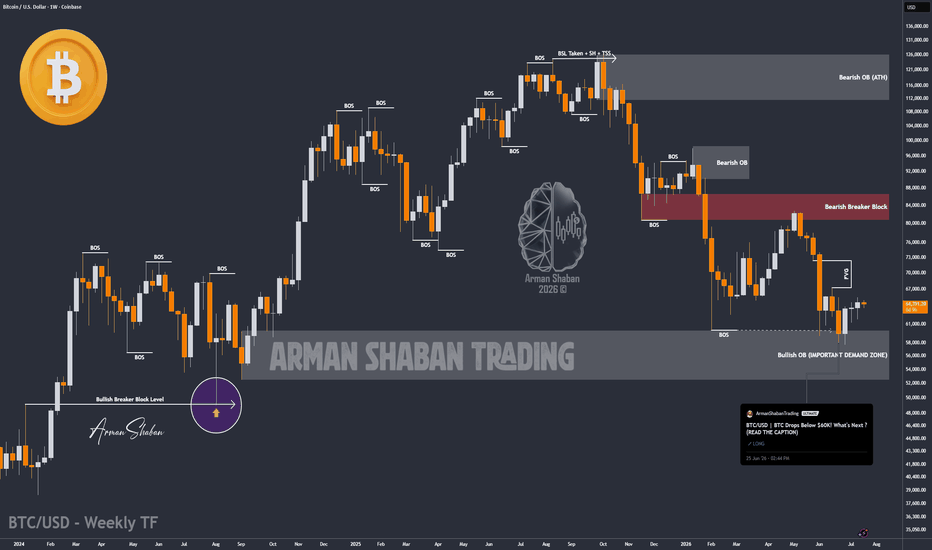
BTC/USD | Bitcoin Keeps Returning To Higher Prices,Is $69K Next?By analyzing the #Bitcoin chart on the weekly timeframe, we can see that price continues to show strong retention at higher levels. Over the past few days, Bitcoin was pushed lower several times, but buyers stepped in quickly each time and drove price back up. BTC is currently trading around $64,300, confirming that demand remains active and sellers are still struggling to keep price down.
In my view, if this buying pressure continues and Bitcoin holds above the key $62,000 – $63,000 area, we could soon see another bullish move toward higher levels. The first major upside target is $69,000. After that, the next targets to monitor are $72,000 and $74,000 if bullish momentum continues.
For now, Bitcoin is still showing strong price retention, and the broader short-term and medium-term outlook remains bullish.
Please support me with your likes and comments to motivate me to share more analysis with you and share your opinion about the possible trend of this chart with me !
Best Regards , Arman Shaban
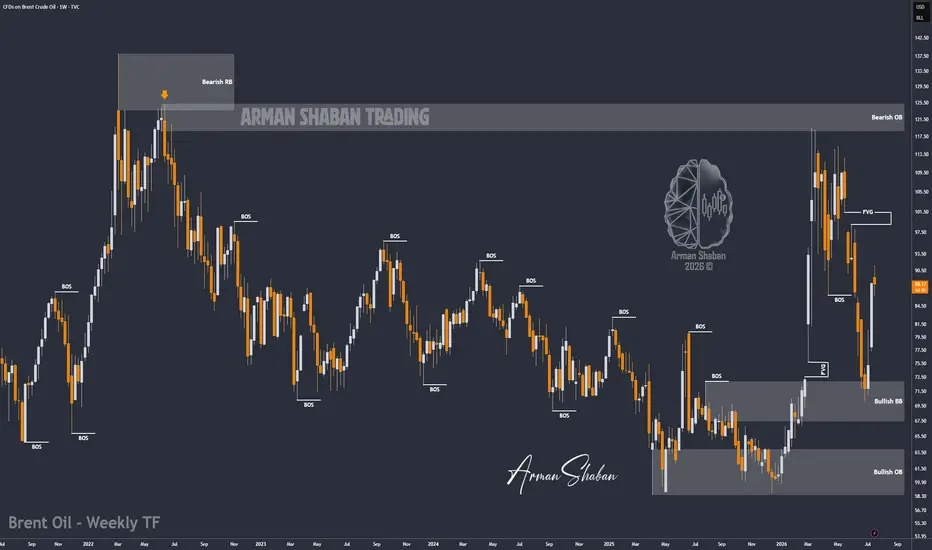
UKOIL | Brent Oil Breaks $90, Are Triple Digits Next?By analyzing the #BrentOil chart on the weekly timeframe, we can see that price continued to follow the expected bullish scenario and finally broke above the psychological $90 level, reaching as high as $91.5.
Currently, Brent Oil is trading around $88 after a minor correction. In my view, this pullback may remain temporary, and if buyers step in again, we could see another bullish move toward higher levels.
The nearest demand zones are located around $86 – $88, followed by stronger support between $82 – $84. On the upside, the next targets to monitor are $92, followed by $95, $98, and then the major psychological level at $100.
If geopolitical tensions continue and supply risks remain elevated, targets above $100 may not be far out of reach. For now, my broader bias remains bullish after this short-term correction.
Please support me with your likes and comments to motivate me to share more analysis with you and share your opinion about the possible trend of this chart with me !
Best Regards , Arman Shaban
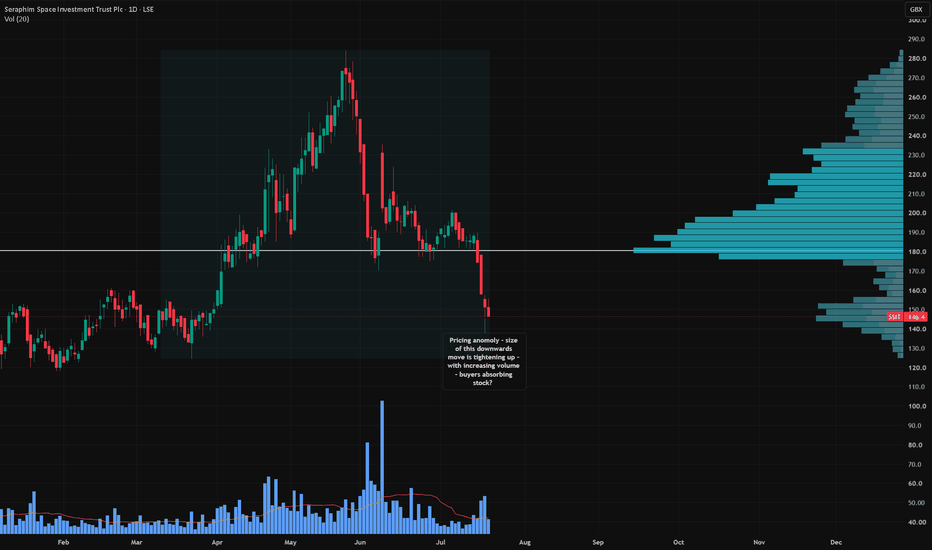
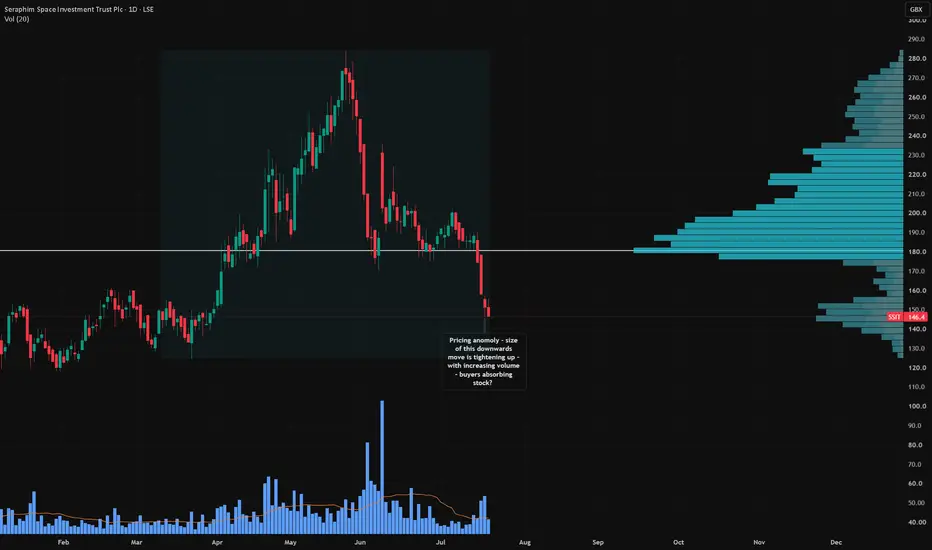
SSIT volume up at 160p former resistance could setup a 80% run?Disclaimer, I hold this one in my SIPP.
There does seem to be a space race going on, and from what I have been reading there is a race back to the Moon so we can harvest it for helium. Pretty cool stuff. For the record, that has nothing to do with SSIT directly, but I do like the notion of holding a basket of space related companies where the costs of deploying to space are far cheaper than they have ever been in the past.
Anyway, price here on Friday has created a bit of a pricing anomaly. As it has approached what was the previous resistance around 160p, the price has tightened up and volume has been creeping in, so buyers could be sat here. This stock is now 80% off its highs, that doesn’t mean it will trade back up there, but I wouldn’t rule it out either.
Price target: 273p
Potential reward: 80%
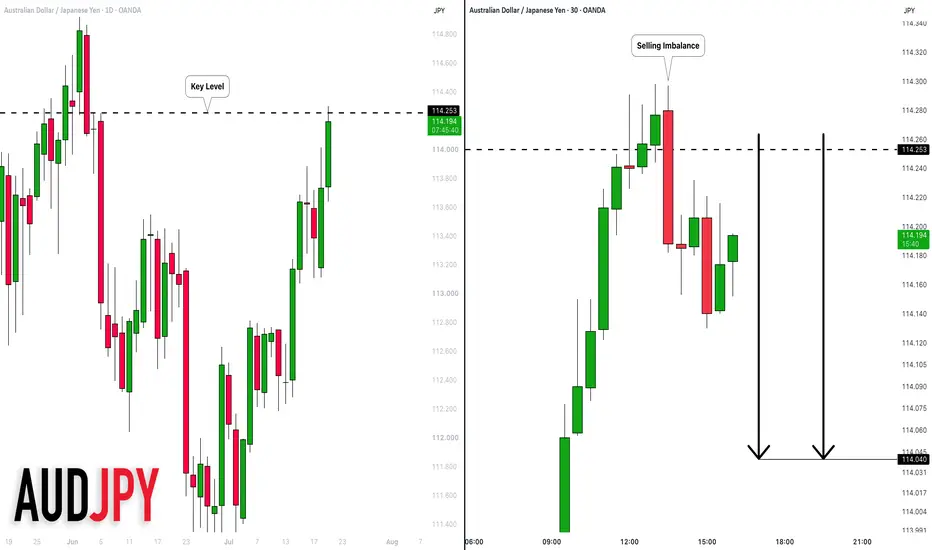
NZDCHF: Overbought Market & Pullback 🇳🇿🇨🇭
NZDCHF will likely retrace from a key historical resistance level.
A bearish choch on an hourly time frame provides a strong confirmation
of the overbought state of the market.
Goal - 0.4739
❤️Please, support my work with like, thank you!❤️
I am part of Trade Nation's Influencer program and receive a monthly fee for using their TradingView charts in my analysis.
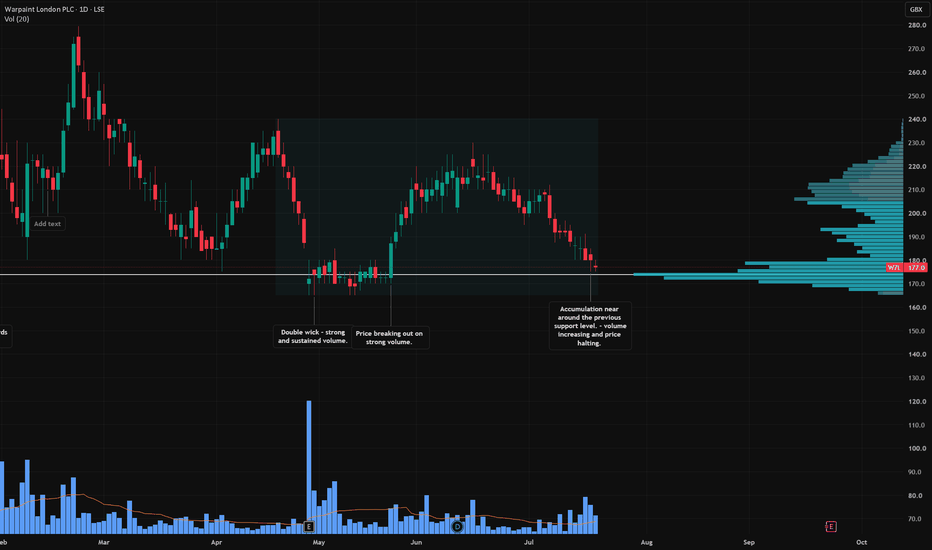
W7L Friday volume rise confirms heavy absorption at key supportThis is probably one of the most interesting looking setups from this week. I draw a lot of confidence when I see price banging up against previous support and resistance areas, and in this case Warpaint London has traded off this current price level around 7 times since November last year. To me, buyers are defending this price and keep absorbing stock every time it comes back to test it.
Take a look at the price action on Friday, price pushing slightly lower yet volumes increasing. This looks like buyers absorbing more stock as it approaches the key price level around 180p. There is heavily weighted volume on the right hand side of the chart too, which adds further weight to the idea that this level is well supported.
Price target: 237p
Potential reward: 31%
Bitcoin's Next Direction Depends on This ZoneBitcoin has returned to a major decision zone after losing its recent bullish structure, making the current reaction one of the most important developments on the higher timeframe.
The recent breakdown from the rising channel shifted momentum in favor of the bears, but price is now testing a long-standing support area around 59k–62k. As long as this zone continues to attract demand, there is still room for a recovery toward the first resistance near 75k, where sellers are expected to challenge the move. A successful breakout above that level would significantly improve bullish momentum and open the path toward the 100k resistance.
On the other hand, a confirmed daily or 3-day close below the highlighted support would invalidate the recovery scenario and expose Bitcoin to a deeper decline toward the projected 45k target. This makes the current region a high-probability inflection point rather than an ideal place to chase price.
Patience is key. Let the market confirm direction before committing, as the next breakout from this critical zone is likely to define Bitcoin's medium-term trend.
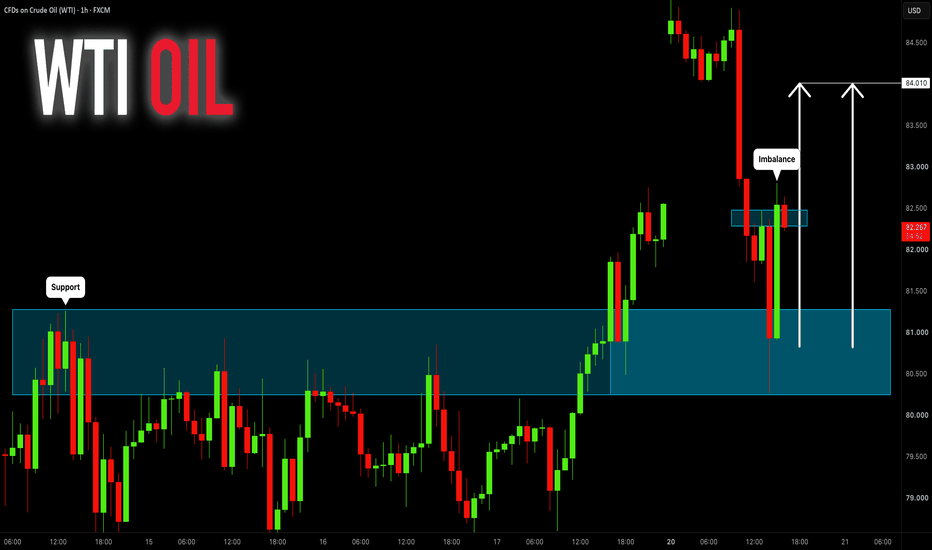
CRUDE OIL (WTI): Bullish Movement Confirmed
I see a strong buying imbalance on WTI Crude Oil after a test
of a significant intraday horizontal support.
The price will likely reach 84.01 level soon.
❤️Please, support my work with like, thank you!❤️
I am part of Trade Nation's Influencer program and receive a monthly fee for using their TradingView charts in my analysis.