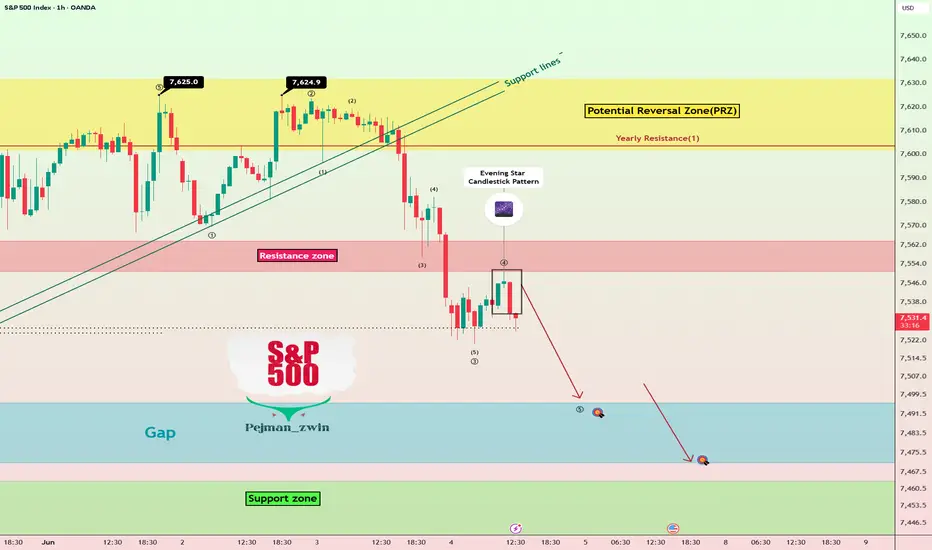
S&P 500 Rejected Near the Highs — More Downside Next?As I expected in the previous idea, the S&P 500 ( FOREXCOM:SPX500 ) started its decline from the Potential Reversal Zone(PRZ) and marked its all-time highs right in that PRZ. After breaking significant support lines, the index began to drop—one key reason for this decline could be the escalating tensions in the Middle East.
Currently, the S&P 500 has broken a support zone($7,564-$7,551) and seems to have completed a pullback to that zone, forming an evening star candlestick pattern. We could expect further downside.
From an Elliott Wave theory standpoint, it appears that the S&P 500 is completing either its major wave 3 or wave 5.
I expect the S&P 500 to decline further once U.S. markets open, aiming to fill the lower Gap($7,496.20-$7,471.40).
First Target: $7,504
Second Target: $7,476
Stop Loss(SL): $7,573
Note: A sharp drop in the S&P 500 could also impact correlated markets like cryptocurrencies, especially Bitcoin( BINANCE:BTCUSDT ).
What’s your view on the S&P 500? Will it continue its decline, or could we see a new all-time high again?
💡 Please respect each other's opinions and express agreement or disagreement politely.
📌 S&P 500 Index Analyze (SPX500USD), 1-hour time frame.
🛑 Always set a Stop Loss(SL) for every position you open.
✅ This is just my idea; I’d love to see your thoughts too!
🔥 If you find it helpful, please BOOST this post and share it with your friends.  Short
Short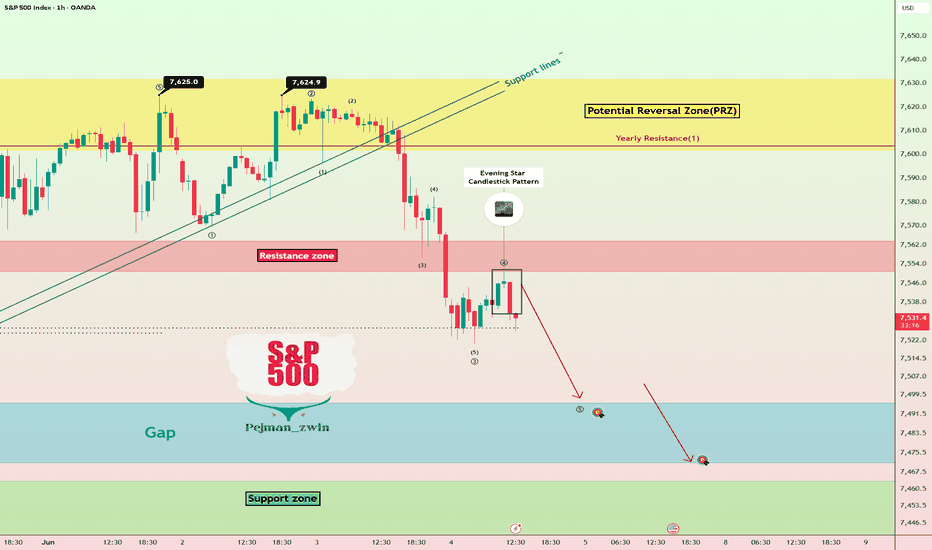
 Long
Long
Shorting a rebound: The cycle-level target may be 4300-4100.Since the release of the NFP data, the market balance has been slowly tilting towards expectations of an interest rate hike, and the market's bearish sentiment has gradually intensified. As the market's bearish sentiment was released, gold prices plummeted from 4475 to the 4400 mark, breaking through multiple structural support levels established in the short term, and the gold bearish trend is expected to continue.
From the current chart pattern, gold has broken through multiple structural support levels established recently and is testing the 4400 level again, continuing the overall downtrend and indicating technical weakness. As gold prices gradually decline, short-term resistance has shifted to the 4420-4440 area, followed by the 4460-4480 area. With both fundamental and technical pressures weighing on the market, gold still has room to fall further, and the 4400 level is expected to be difficult to hold. From a cyclical perspective, gold may slowly move towards the 4300-4100 range, but this will take some time.
Short-term technical support levels: 4360-4340 / 4280-4260
Short-term technical resistance levels: 4420-4440 / 4460-4480
Therefore, in terms of short-term trading, if gold can rebound to the 4425-4445 area, I will consider shorting gold first.  Short
Short
XAU/USD | Gold Rejected Perfectly From The Supply Zone Again!By analyzing the #Gold chart on the 4H timeframe, we can see that this time the bullish continuation scenario did not materialize. However, price reacted beautifully from the exact supply zone that we had highlighted in the previous update.
After reaching the $4515 supply area, sellers stepped in aggressively and completely rejected the bullish move. The market then entered a strong bearish phase and accelerated lower throughout the session.
Adding fuel to the move, today's NFP release strengthened bearish momentum even further, helping Gold break below the major $4400 level and push toward the $4365 region.
More importantly, Gold successfully swept the liquidity resting below $4365, exactly as anticipated in our previous analysis. This confirms that the market continues to respect the key liquidity levels we have been tracking.
From a structural perspective, the nearest supply zones are now located around $4390 – $4420, followed by a stronger resistance cluster between $4450 – $4480. On the downside, the closest demand zones are located around $4335 – $4365, with deeper structural support sitting near $4300 – $4320.
In my view, there is now a strong probability that Gold attempts a short-term corrective bounce from the $4335 – $4365 demand zone after completing the recent liquidity sweep. If buyers manage to defend this area, the first upside targets would be $4390, followed by $4420, then $4450. A stronger recovery could even extend toward the $4480 region before sellers become active again.
That said, this would still be considered a corrective move inside a broader bearish structure. Until Gold reclaims the higher supply zones, sellers remain in control and the overall bias remains bearish.
This analysis will be updated as the market evolves.
Please support me with your likes and comments to motivate me to share more analysis with you and share your opinion about the possible trend of this chart with me !
Best Regards , Arman Shaban Long 
Short 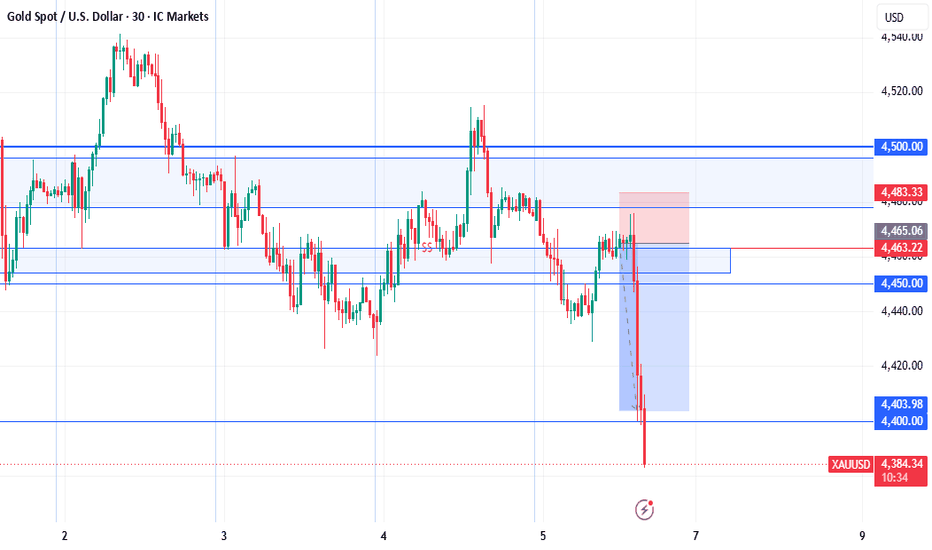
XAU/USD | Rebounds Above $4500 After Another NewsDriven ReversalBy analyzing the #Gold chart on the 4H timeframe, we can see that price initially continued lower after the previous update and printed a fresh low around $4425. However, once again buyers stepped in aggressively from the demand zone and triggered a strong recovery.
At the same time, several major geopolitical headlines supported the move higher. Reports regarding a ceasefire between Israel and Lebanon, along with the U.S. House of Representatives voting to limit potential military action against Iran, helped improve market sentiment and pushed Gold back above the $4500 level.
Currently, Gold is trading around $4510 and the short-term momentum has shifted back toward the upside. If buyers continue defending higher lows, the probability of further bullish expansion increases.
From a structural perspective, the nearest demand zones are now located around $4470 – $4490, followed by a stronger demand cluster between $4420 – $4440. On the upside, the closest supply zones are located around $4525 – $4550, followed by a stronger resistance area between $4580 – $4620.
However, traders should remain cautious. This is already the third or fourth time this week that major geopolitical headlines have completely reversed market sentiment within hours. One day the market prices in escalation, the next day it prices in de-escalation. Because of that, it's better to focus on the key supply and demand zones rather than becoming emotionally attached to any single narrative.
For now, as long as Gold remains above the $4470 – $4490 demand zone, the probability of another push toward higher supply levels remains elevated.
Please support me with your likes and comments to motivate me to share more analysis with you and share your opinion about the possible trend of this chart with me !
Best Regards , Arman Shaban Long 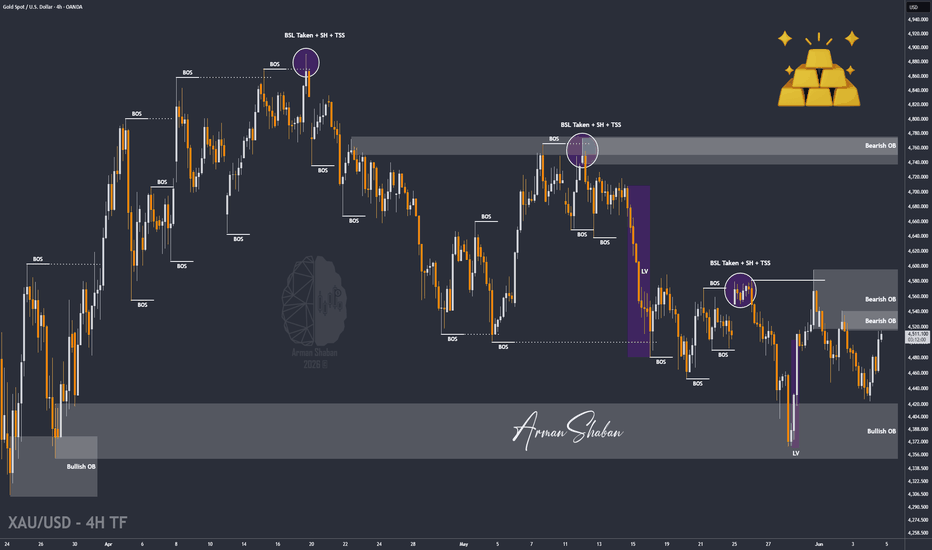
TON structural reset: $1.534 decides the next moveThe Macro Picture 🗺️
The breakout flagged on June 1 has fully reversed, and the bullish arc built across the previous four Ideas has unwound in sequence. TON rejected from the $2.15 area inside the distribution layer, lost $1.95, then broke through the $1.65 invalidation that defined the entire bullish thesis. Price has now stalled at $1.534, where the post-correction structure attempts to find new footing. The bullish thesis is closed, but a clean continuation toward the macro floor at $1.20 is not yet confirmed. Structure is in reset mode, and $1.534 is the pivot that decides whether the broken base builds a new equilibrium or extends toward the floor.
The Setup ⚙️
The Failed Breakout: The $2.05 reclaim that powered the move toward $2.50 has been recovered by sellers, and the broken support pocket above now functions as overhead supply. Every bounce attempt gets faded inside the same structure that used to defend the move.
The Reset Zone: The $1.534 line is where the breakdown has
paused, and the next sessions decide whether bulls can rebuild here or whether the macro floor at $1.20 absorbs the next leg. Holding above this pivot opens a ranging recovery; losing it cleanly puts the floor back in play.
The Reaction: RSI has rolled from the breakout high near 60 back toward 35, with momentum fully neutralised on the bearish side. No structural support exists between $1.534 and $1.20 to absorb a continuation, but the freefall has stalled and the chart is no longer in directional motion.
The Roadmap: Primary recovery target sits at $1.95–$2.05 — a clean defense of $1.534 opens a ranging attempt back into the failed support pocket where the next decision happens. Invalidation: a sustained 1D close below $1.534 would invalidate this reset thesis and open the path toward the $1.20 macro floor as the next magnet. T

 Long
Long
 Long
Long
Gold ready for liftoff, 4600 is the next big target!Gold prices rebounded after hitting a low during the day, finding support at a key level and stabilizing, making it difficult for the bears to sustain their gains. Meanwhile, the bulls rallied, steadily rising from the lows and breaking through multiple resistance levels at 4460, 4480, and 4500, gradually warming up market sentiment.
From the current technical chart pattern, gold is forming a second inverted head and shoulders (A’B’C’) support pattern centered around 4455 and 4424, and is currently searching for the right shoulder structure with support in the 4480-4460 area. If this support structure (A’B’C’) is successfully formed, combined with the support of the previous inverted head and shoulders (ABC) pattern, gold will benefit from this double support and is expected to continue its upward trend, retesting the 4540-4560 resistance area, and may even reclaim 4600.
Short-term technical support levels: 4480-4460 / 4440-4420
Short-term technical resistance levels: 4540-4560 / 4580-4600
Therefore, in terms of short-term trading, I believe the 4480-4460 area will be a good entry point for long positions. Long 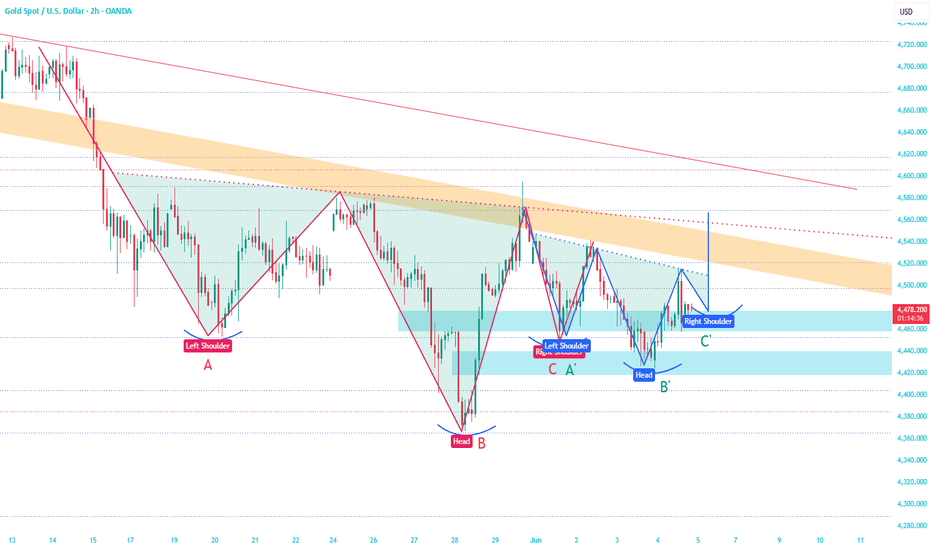
BTC/USDT –The map no one wants to look at.Let's zoom all the way out. Pure Support & Resistance on the weekly chart – no noise, just structure.
BTC has sold off hard from the ATH at $126,198. Price is now sitting right at the $61,500 support zone – a level that has been relevant multiple times across this entire cycle.
Below here, the Fibonacci Golden Pocket sits between $57,825 and $54,285. That's where buyers have historically stepped in with conviction.
Two scenarios from here:
🟢 $61,500 holds. BTC stabilises, builds structure and begins a recovery towards $76,000, then $81,500 and beyond.
🔴 $61,500 fails. Price slides into the Golden Pocket at $57,825–$54,285. If that zone also breaks, $47,500 and $35,000 come into play.
The weekly close this week is critical. It will tell us whether this is a shakeout or the beginning of something deeper.
One candle at a time.
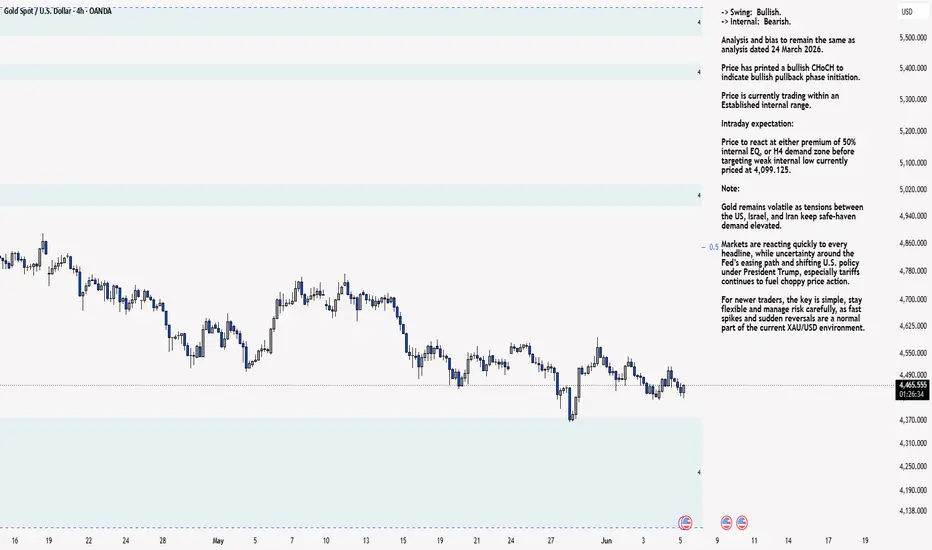
Trade your plan. I share mine. XAU/USD 05 June 2026 Intraday AnalysisH4 Analysis:
-> Swing: Bullish.
-> Internal: Bearish.
Analysis and bias to remain the same as analysis dated 24 March 2026.
Price has printed a bullish CHoCH to indicate bullish pullback phase initiation.
Price is currently trading within an Established internal range.
Intraday expectation:
Price to react at either premium of 50% internal EQ, or H4 demand zone before targeting weak internal low currently priced at 4,099.125.
Note:
Gold remains volatile as tensions between the US, Israel, and Iran keep safe‑haven demand elevated.
Markets are reacting quickly to every headline, while uncertainty around the Fed’s easing path and shifting U.S. policy under President Trump, especially tariffs continues to fuel choppy price action.
For newer traders, the key is simple, stay flexible and manage risk carefully, as fast spikes and sudden reversals are a normal part of the current XAU/USD environment.
H4 Chart:
M15 Analysis:
-> Swing: Bearish.
-> Internal: Bullish.
Analysis and bias to remain the same as analysis dated 01 June 2026.
Price has not printed according to my analysis dated 28 May 2026.
Price did not target weak internal low, instead printing a bullish iBOS. However, I am not entirely convinced of the bullish iBOS to the insignificant nature of the iBOS.
Nonetheless, I shall follow a systematic procedure and classify this as an iBOS.
Price has subsequently printed a bearish iBOS to indicate, but not confirm bearish pullback phase initiation.
Intraday expectation:
Price to trade down to either discount of 50% internal EQ, or M15 demand zone before targeting weak internal high, priced at 4,595.330.
Note:
Gold remains highly reactive on the M15 as geopolitical risk continues to drive quick, headline‑led moves.
The tension between the US, Israel, and Iran is keeping safe‑haven demand elevated, with markets still sensitive to any sign of escalation.
At the same time, shifting US tariff policy under President Trump is adding extra uncertainty, fuelling sharp intraday swings and increasing the likelihood of sudden sentiment flips. Liquidity pockets and whipsaws remain common, making disciplined risk management essential.
Gold’s geopolitical premium is still firmly in place, and until tensions ease, short‑term volatility is likely to stay front‑loaded.
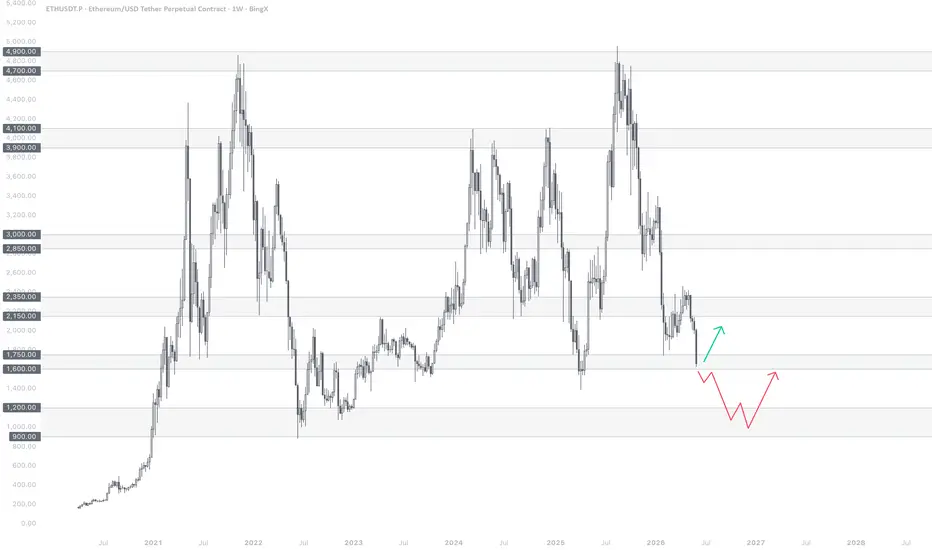
M15 Chart: ETH/USDT Weekly – The moment of truth.ETH | Weekly – Time to zoom out. 🔭
Let's step back from the noise and look at the bigger picture – pure Support & Resistance on the weekly chart.
The last few days ETH pushed down with impulse. It looks like the previous pullback has finished and price is now approaching the next major support zone between $1,750 and $1,600. Historically, this area has mattered.
This is where reversals happen. Or don't.
Two scenarios from here:
🟢 The $1,750–$1,600 zone holds, ETH finds buyers and structure begins to recover. First meaningful resistance sits at $2,150, then $2,350.
🔴 The zone fails to hold. Weekly candle closes weak, sentiment shifts and $1,200 becomes the next destination.
The weekly close will tell us everything. No need to guess before then.
Patience is still a position.
Trade your plan. I share mine.  Short
Short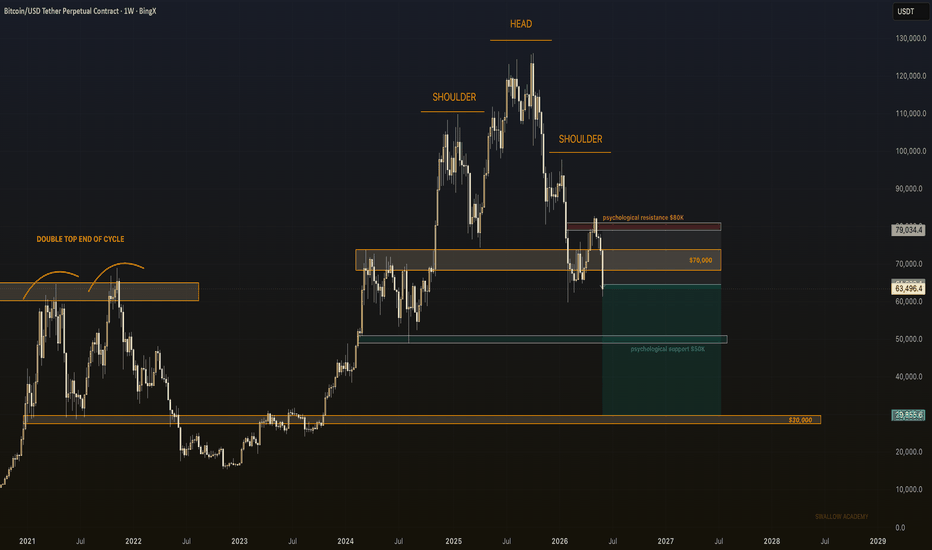
 Long
Long
 Long
Long
Buy gold now:The race to 4600 may have begun!After gold dipped to around 4424 during the day, bulls quickly launched a counterattack, strengthening continuously in the short term and breaking through short-term resistance, reaching a high of around 4515. Technically, initial signs of a bottom have emerged.
From the current technical structure, gold has formed an inverted head and shoulders support pattern in the areas around 4453, 4366, and 4455. In the process of repeated testing and verification recently, gold is showing signs of forming a second inverted head and shoulders support pattern centered around 4455 and 4424. However, the right shoulder structure of the complete inverted head and shoulders pattern is still missing. Currently, gold's primary support lies in the 4480-4460 area. If gold forms a right shoulder pattern within this area during a pullback, the double inverted head and shoulders support pattern will be further strengthened, favoring a continuation of the upward trend and a retest of the 4540-4560 resistance zone, potentially even pushing it back above 4600.
Short-term technical support levels: 4480-4460 / 4440-4420
Short-term technical resistance levels: 4540-4560 / 4580-4600
Therefore, in short-term trading, I would first consider going long on gold in the 4485-4465 area. Long 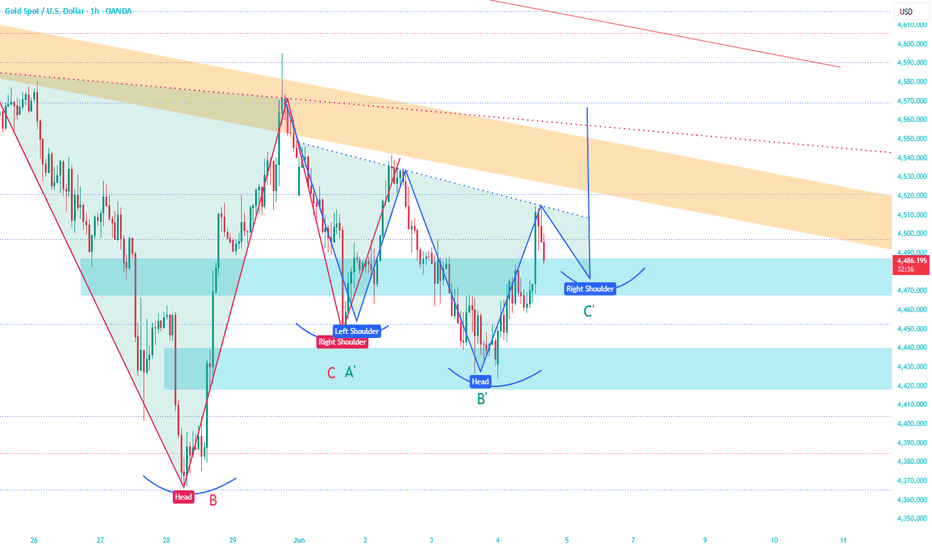
 Long
Long