NKE — Light at the end of the tunnel ?Nike is approaching a major Potential Reversal Zone around $20-25, where a long-term Bullish Crab harmonic pattern could complete.
Price has been selling off for several years, and the $20-25 PRZ is the key area I’m watching for a potential reversal.
Trade Setup
Entry: $20-25
Stop Loss: $15.0
TP1: $52
TP2: $81
TP3: $140
TP4: $250
The $20-25 PRZ is the most important level on the chart. If the Bullish Crab completes there and we get confirmation of a reversal, this could become a very interesting long-term setup.
What makes the setup especially interesting is the potential upside compared with the downside risk. If the harmonic pattern plays out as expected, the move from the PRZ toward the higher targets would represent a very large potential return.
And unlike a typical speculative asset, Nike also pays a quarterly dividend. Nike most recently declared a $0.41 per-share quarterly dividend, and the company reported 24 consecutive years of increasing dividend payouts through its fiscal 2026 third-quarter results.
My Take
In my opinion, $20-25 would be a very attractive level to watch if the Bullish Crab confirms at the PRZ. If the technical analysis is correct and the pattern produces the expected reversal, the potential return could be substantial — potentially one of the more significant long-term setups outside of highly speculative markets like crypto.
The key word is confirmation. I wouldn't assume the Crab will work simply because price reaches $20-25. I want to see buyers step in and the reversal begin before considering the pattern confirmed.
$20-25 PRZ → confirmation → potential targets of $52, $81, $140 and $250.
A break below $15 would invalidate the setup.  Long
Long
 Long
Long
 Short
Short
 Long
Long
DXY Harmonic Pattern | US Dollar Index ForecastDXY Harmonic Pattern | US Dollar Index Forecast, DXY Analysis & Major Downside Target
DXY (US Dollar Index) is developing a harmonic XABCD pattern on the higher timeframe, with price currently trading around the 99.00 area after rejecting the 108–110 resistance zone.
The DXY technical analysis shows a clear XABCD structure, with the Fibonacci ratios marked on the chart suggesting a potential completion zone near 73–75. If the pattern plays out, the current rebound could be a corrective move before another major leg lower in the US Dollar Index.
DXY Bearish Setup
The key structure is:
X: Major low around 90
A: Major high around 115
B: Retracement toward 100
C: Recovery toward 110
D: Projected harmonic completion around 73–75
The highlighted 90–94 support zone is an important area to watch. A move into this zone could initially attract buyers, but a confirmed breakdown would significantly strengthen the longer-term bearish DXY forecast.
Bitcoin, Gold & Forex Implications
A sustained decline in the US Dollar Index could have important implications across financial markets.
A weaker DXY generally creates a more supportive environment for Gold (XAUUSD) and can provide upside pressure for major currency pairs such as EURUSD, GBPUSD and AUDUSD. It can also become a supportive macro factor for Bitcoin and cryptocurrency markets, although correlation is not guaranteed.
For traders following DXY analysis, US Dollar Index forecast, DXY price prediction, and macro Forex trading, the next major reaction around resistance and support will be critical.
Bearish Scenario
As long as DXY remains below the major descending resistance structure, the bearish price action remains valid.
A confirmed breakdown of the current consolidation could open the way toward:
Target 1: 94–92 support zone
Target 2: 90 area
Major Harmonic Target: 73–75 area
The 73–75 region represents the projected XABCD harmonic completion zone shown on the chart and should be treated as a long-term technical target rather than an immediate price objective.
What Would Invalidate the Setup?
A sustained breakout above the descending resistance structure and a decisive reclaim of the 108–110 region would weaken the bearish DXY forecast and invalidate the current downside projection.
For now, the chart favors watching for DXY rejection, bearish price action, and support breakdown confirmation rather than chasing the move.
Key themes: DXY forecast, US Dollar Index analysis, DXY price prediction, harmonic pattern, Fibonacci trading, Forex technical analysis, dollar weakness, Bitcoin correlation, Gold analysis and macro trading.
This analysis is for educational purposes only and is not financial advice. Always manage risk and wait for confirmation before entering a trade.  Short
Short
ABT | Bullish Harmonic Reversal Zone at Major Support
ABT | Bullish Harmonic Reversal Zone at Major Support
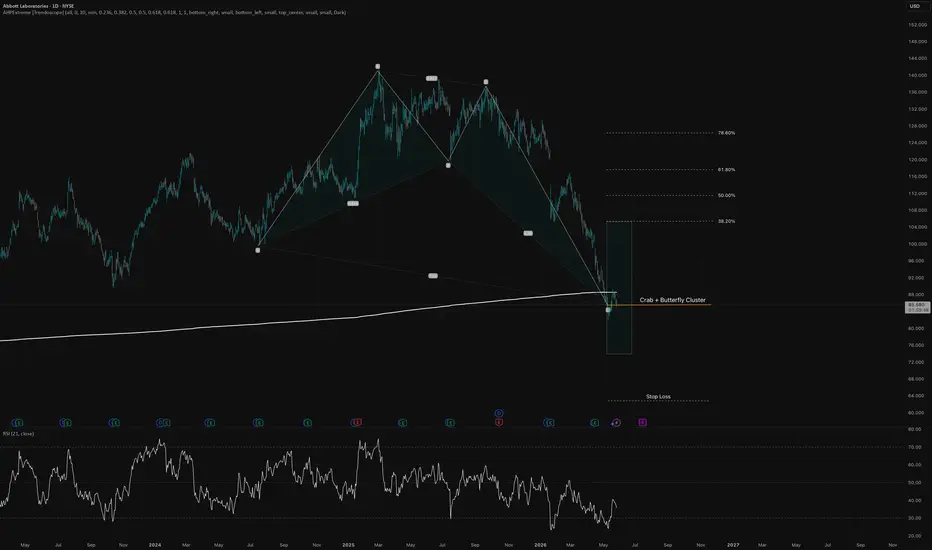
Abbott Laboratories is currently trading into a technically important reaction area on the daily chart.
After the strong decline from the 2025 highs, price has reached a potential harmonic completion zone where multiple projections appear to cluster. The area around 85–88 USD is especially relevant, as it aligns with:
* a potential Bullish Crab / Butterfly completion zone
* a visible harmonic pattern cluster
* a long-term rising support / moving average area
* a psychologically important former support region
* an oversold recovery attempt on the RSI
From a structure perspective, ABT has completed a sharp corrective leg into the projected D-zone. This makes the current area interesting for a possible bullish reversal, but confirmation is still important.
The first key signal would be a strong daily reaction from the current zone, ideally followed by a reclaim above the short-term structure around **88–90 USD**. A higher low after that reclaim would strengthen the bullish case.
Bullish Scenario
If price confirms support in the current zone, the first upside objective would be the lower Fibonacci retracement area around **104–106 USD**. Above that, the next relevant targets are located near:
**TP1:** 104–106 USD
**TP2:** 118–120 USD
**TP3:** 136–138 USD
The 0.618 retracement area near 118–120 USD is particularly important, as this would be the first major test of whether the reversal is only a corrective bounce or the beginning of a broader recovery.
Bearish Scenario
The setup loses quality if ABT fails to hold the harmonic completion zone and breaks clearly below the current support area. A decisive daily close below the PRZ would indicate that the pattern is failing and that lower prices could follow.
For now, the chart is not a blind long signal, but it is a technically attractive reversal watchlist setup. The current zone offers a clean risk-defined area, while the upside potential remains significant if buyers step in.
Conclusion:
ABT is trading at a relevant harmonic support cluster. A confirmed bullish reaction from this area could open the door for a recovery toward 105 USD, 120 USD and potentially 137 USD. Confirmation remains key.  Long
Long
 Long
Long
 Short
Short
 Long
Long
Long 
Educational Technical Analysis ARRSBLEducational Technical Analysis: Bullish Crab Pattern
1. Understanding Harmonic Patterns
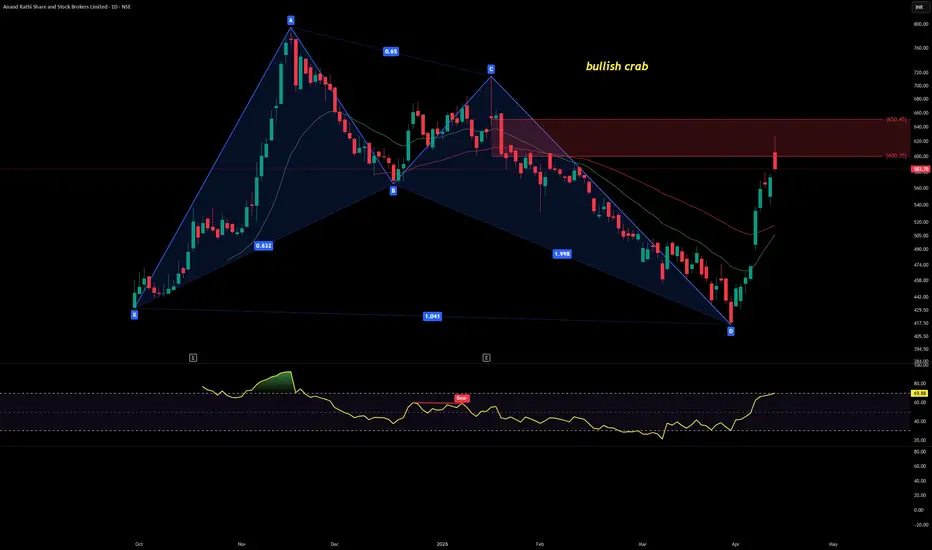
Harmonic patterns are advanced chart formations that use Fibonacci ratios to identify potential reversal zones. In this chart, we see a Bullish Crab pattern, which is known for its deep retracement and sharp reversal potential. The key points (X, A, B, C, D) form the structure, with ratios confirming the validity of the pattern:
XA retracement: Point B retraces ~65% of XA
BC retracement: Point C retraces ~65% of AB
CD extension: Point D extends ~200% of BC
Final confirmation: The overall structure aligns with the Crab’s geometry
This teaches traders how Fibonacci ratios are not random numbers but precise tools to validate harmonic setups.
2. The Potential Reversal Zone (PRZ)
The shaded red zone between ₹600–₹650 represents the PRZ. In harmonic trading, this is the area where price exhaustion is expected, and a reversal may occur.
Traders should not blindly buy at PRZ.
Instead, they wait for confirmation signals (candlestick reversal, volume spike, or momentum divergence).
This emphasizes the principle: Patterns suggest possibilities, not certainties.
3. RSI as a Supporting Indicator
The Relative Strength Index (RSI) is plotted below the chart, currently near 69.88.
RSI above 70 often signals overbought conditions.
Here, RSI is approaching that level, aligning with the PRZ resistance zone.
This confluence strengthens the educational takeaway: multiple tools should confirm a setup before acting.
4. Key Learning Points for Traders
Harmonic patterns like the Bullish Crab are powerful but require strict ratio validation.
The PRZ is a zone of interest, not a guaranteed reversal.
Always combine harmonic analysis with momentum indicators (like RSI) and price action signals.
Risk management is crucial: stop‑losses should be placed beyond the PRZ to protect against failed patterns.
5. Conclusion
This chart is a textbook example of how harmonics, Fibonacci ratios, and RSI can work together to highlight potential turning points. For learners, the main lesson is not just spotting the pattern, but understanding why it works and how to confirm it responsibly.  Short
Short
 Long
Long
 Long
Long
 Long
Long
 Short
Short
Elloit wave ETH 1/5/2026Initially, I thought that the wave count from wave(i) to wave(ii) might be wave C, completing the correction in the scinario that wave 4 is not end yet. However, upon reconsideration, the recent downward pressure can also be counted as an impulsive wave i, and it appears too steep to be a corrective move.
Another supporting factor is that the price action following this downward move is clearly corrective, forming a very complex wave structure. The Deep Crab harmonic pattern suggests a reversal zone around 3,180–3,190, which aligns closely with the recent reversal point. This wave count also indicates that wave 4 is nearing completion.
The projected target for wave (v) is around 2,400, supported by butterfly harmonic projections and coinciding with a strong support zone.
The invalidation level for this scenario is a break above 3,330 since wave (ii) should not break above 0.8 retace ment of wae (i).In that case ,ETH wave 4 will not finish yet but the reversal should be soon reaveled Short 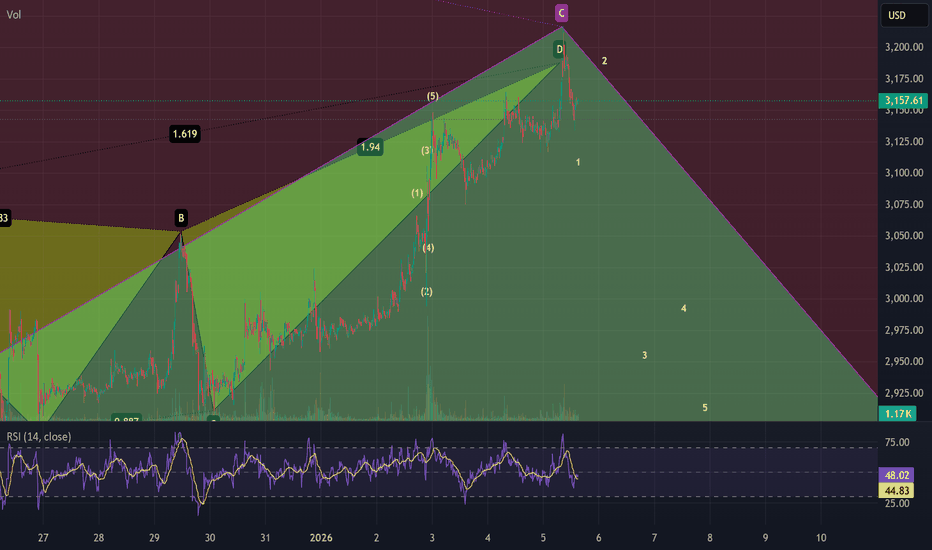
 Short
Short
 Long
Long
 Long
Long