Tron to accelerate into the next bull market 3 x cup and handle Bullish on TRX Tron because it has performed relatively well during the bear market against its piers
Its price is sitting over a trend line which if you extrapolate and assume the bullish cycle lasts about the same 3 years. It takes us to the Cup and handle target.
The cup-and-handle pattern shown is based on several assumptions, using a line of best fit across the key support and resistance levels. The spike lows have been treated as valid data points, while the spike highs have been discounted due to the lower volume traded at those levels compared to the lows.
This analysis produces a target around the whole number "1" together with a possible wedge continuation pattern enroute
In a bull market, I would expect TRX to outperform and potentially deliver more than a 3x return. However, a 3x gain is still a respectable outcome for a top-10 cryptocurrency that has remained relatively strong throughout the bear market. Could it go much higher? Absolutely. But it's important to remain realistic and manage risk appropriately.
Personally, I'd be happy to bank a 3x return rather than endure excessive drawdowns chasing larger gains. As long as price remains above the dotted trend line, this appears to be a reasonable strategy for potentially tripling your investment. This isn't financial advice—just a practical approach based on risk versus reward.
The timeframe for this setup is approximately three years. If TRX experiences a strong move earlier than expected, there may be an opportunity to take profits and rotate that capital into another token that tends to perform later in the bull cycle. In that scenario, you could potentially achieve a 3x return on TRX and then another 2x–3x elsewhere.
That would result in an overall return of 6x–9x during the cycle, while starting from a relatively conservative position. Of course, "safe" is a relative term in cryptocurrency, which remains a high-risk asset class, but the goal is to maximize returns while minimizing unnecessary risk.
Cup And Handle
RSI 1W - gambling or smart retest?Rush Street Interactive (RSI) just confirmed a breakout above the 15–16 zone with a textbook retest - a classic bullish setup. The weekly chart shows a clean “cup and handle” structure backed by rising volume. Current pullback is forming right inside the buy zone, suggesting potential continuation.
Fibonacci extensions highlight 30.7 and 43.9 as key upside targets. As long as price holds above 15.5–16.0, the bullish bias stays intact. A breakout above 18.0 would confirm the next leg higher.
Fundamentally , RSI benefits from ongoing online gambling legalization across the US and improving profitability in core states, which could attract institutional inflows.
In the gambling world, luck rarely repeats - but this chart looks like the house might finally lose.
Will Adidas (ADS) Continue the Uptrend ?
Adidas (ADS) appears to be breaking out of a classic cup-and-handle formation, with price reclaiming the €170 neckline after a healthy handle consolidation.
Technical highlights:
Cup-and-handle breakout in progress
MACD remains bullish
Strong relative momentum
Measured move projects €200 initially, with €230 as an extended target
Fundamental tailwinds:
Official FIFA World Cup 2026 partner and match-ball supplier
Strong Q1 results already boosted by World Cup demand
July earnings could act as the next major catalyst
Management continues to guide for strong sales and profit growth into 2026
Key level to watch: A sustained hold above €170-175 would strengthen the bullish breakout thesis and open the path toward the €200 target.
$WING - Cup and Handle Breakout on Growing Volume💡 Swing setup idea
Bullish pattern
🔎 Analysis summary:
The stock recently broke above the 50 SMA and successfully closed a small cup and handle pattern.
Growing buyers volume is stepping in, showing increasing momentum behind the move.
👀 Levels to watch:
Entry trigger: Break above $162.38
Target: $207.58
Stop: Under the breakout level
💬 What do you think of this setup? Let me know in the comments! 👇
Good luck!
⚠️ Note: This is for educational purposes only and is not financial advice.
Take a voyage and enjoy cup of the space industry? Hot topic sector: Space
It is setting up before the SpaceX IPO - a boost for sympathetic or proxy trades.
Long period of consolidation with little chop.
Technical pattern: Cup-and-handle. And a quite nice handle that also appears as a bull flag.
Volume impulse off the handle over the 20 day MA.
Ready to break $50. One of these key psychological levels ($50, $100, $200 ...) that had caught Jesse Livermore's attention in "How to Trade in Stocks".
“Many years ago I began to profit from the simplest type of Pivot Points trades. Frequently I had observed that when a stock sold at 50, 100, 200 and even 300, a fast and straight movement almost invariably occurred after such points were passed.” - Jesse Livermore
Summary: If this isn't a valid bullish setup.... what is?
HH-HL pattern in a beautiful round bottom.VELO started making HH-HL pattern in a beautiful round bottom. After hitting an HH, it has retraced back to EMA 20, and respected the gap. It is going to test the HH at 21.5 and likely going to break it.
Real test will be at 23.8. If it is able to breakout that level and sustain above, it is likely going to double up, with 35-39 as the target area. Should not close below 15.5(SL) on Daily TF.
NLong
$HOG - Potential Huge Cup and Handle Above 50 SMA💡 Swing setup idea
Huge cup & handle
🔎 Analysis summary:
The stock is holding strong above the 50 SMA and is currently setting up a potential huge cup and handle pattern.
🔔 Friendly reminder: The S&P 500 is currently trending down, so please keep the broader market weakness in mind.
👀 Levels to watch:
Entry trigger: Break above $25.93
Target: $34.77
Stop: Under the breakout level
💬 What do you think of this setup? Let me know in the comments! 👇
Good luck!
⚠️ Note: This is for educational purposes only and is not financial advice.
$RLI - 50 SMA Cross and Potential Cup and Handle💡 Swing setup idea
Cup and handle
🔎 Analysis summary:
The stock just crossed above the 50 SMA and is setting up a potential small cup and handle pattern.
Growing buyers volume is stepping in, showing increasing interest and upward momentum.
🔔 Friendly reminder: The S&P 500 is currently trending down, so please keep the broader market weakness in mind.
👀 Levels to watch:
Entry trigger: Break above $54.18
Target: $61.09
Stop: Under the breakout level
💬 What do you think of this setup? Let me know in the comments! 👇
Good luck!
⚠️ Note: This is for educational purposes only and is not financial advice.
$APO - Cup and Handle Breakout Watch💡 Swing setup idea
Watchlist setup / Bullish breakout
🔎 Analysis summary:
The stock broke above the 50 SMA and successfully closed a cup and handle pattern. This is a great setup to keep on the watchlist as it approaches our key entry level.
🔔 Friendly reminder: The S&P 500 is currently trending down, so please keep the broader market weakness in mind.
👀 Levels to watch:
Entry trigger: Break above $135.30
Target: $170.91
Stop: Under the breakout level
💬 What do you think of this setup? Let me know in the comments! 👇
Good luck!
⚠️ Note: This is for educational purposes only and is not financial advice.
Kwality Walls Ltd–Cup & Handle Breakout with Flag ConsolidationKwality Walls appears to have completed a large Cup & Handle formation, followed by a strong breakout above the long-term resistance zone around ₹29–30. After the breakout, the stock rallied sharply and is now undergoing a healthy consolidation through a descending flag pattern near the recent highs.
The current pullback is taking place above the breakout area, suggesting that the previous resistance may now act as support. If buyers step in from the highlighted demand zone, the stock could resume its upward trend toward the projected target area.
Technical Observations:
🔹 Multi-month Cup & Handle breakout confirmed
🔹 Previous resistance zone around ₹29–30 successfully crossed
🔹 Short-term Descending Flag consolidation visible
🔹 Immediate demand zone near ₹32–33
🔹 Structure remains bullish while higher lows are maintained
Trading Plan:
✅ Bullish above flag resistance breakout
🎯 Target Zone: ₹39–40
🛑 Support Zone: ₹32–33
Disclaimer: This analysis is shared for educational purposes only and should not be considered investment advice. Always manage risk before taking any trade.
$WAL - 50SMA Breakout with Cup and Handle Pattern💡 Swing setup idea
Bullish cup & handle
🔎 Analysis summary:
The stock pushed above the 50 SMA, successfully closing a classic cup and handle pattern.
Rising buyers volume is coming in, showing strong momentum behind the move.
🔔 Friendly reminder: The S&P 500 is currently trending down, so please keep the broader market weakness in mind before entering any new trades.
👀 Levels to watch:
Entry trigger: Break above $82.94
Target: $100.00
Stop: Under the breakout level
💬 What do you think of this setup? Let me know in the comments! 👇
Good luck!
⚠️ Note: This is for educational purposes only and is not financial advice.
AUDCHF | 4H CUP & HANDLE BREAKOUT SETUP | BULLISH CONTINUATION#AUDCHF is showing a strong bullish market structure, consistently forming Higher Highs (HH) and Higher Lows (HL) — a clear sign of trend strength.
On the 4H timeframe, price is currently developing a Cup & Handle pattern, which is a classic continuation setup in an uptrend.
What makes this setup interesting?
Clean uptrend structure (HHs & HLs)
Strong bullish momentum
No major bearish divergence or weakness
Well-formed Cup & Handle pattern
Trading Plan:
Wait for a confirmed breakout above the resistance
Look for a retest of the breakout zone
Enter LONG on confirmation
Maintain proper risk management (use SL below handle structure)
Why this matters?
Patience is key — entering after confirmation + retest increases probability and reduces risk of fakeouts.
What do you think?
Is #AUDCHF ready for the next bullish leg or do you see a trap here?
👍 Like | 💬 Comment | ⭐ Follow for more high-probability setups
#AUDCHF #Forex #ForexTrading #TradingView #TechnicalAnalysis #PriceAction #CupAndHandle #ForexSignals #TradingIdeas #SmartMoney #ICT #DayTrading #SwingTrading #Bullish #BreakoutTrading #RiskManagement #FXMarket #TraderLife
What the HEX?!Where is the HEX price pointing towards.
This is HEX on #Pulsechain btw.
I suspect a zero will be added in the coming year.
Price is action is getting compressed against a key level which has been tested plaenty of times before.
So in effect a floor that is very likely with minimal strength to uphold an exit stampede during a crypto winter.
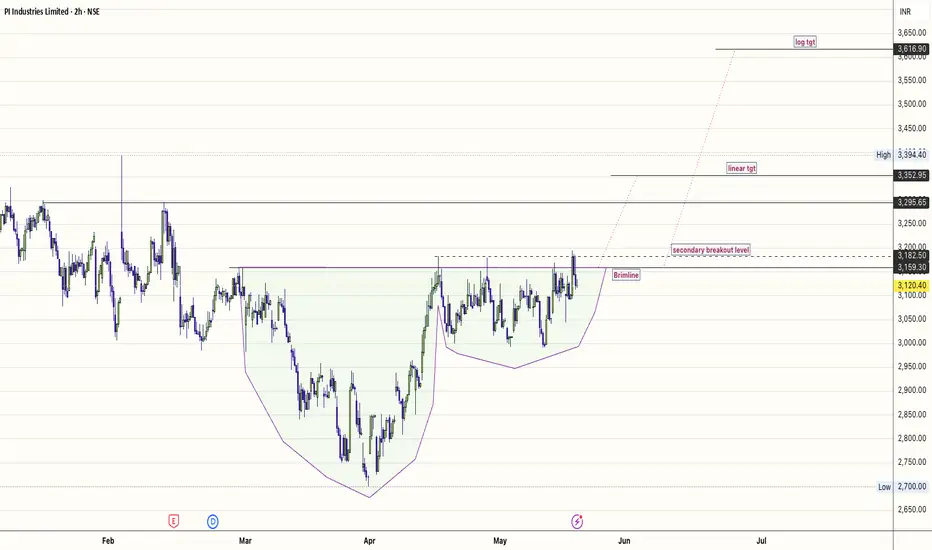
Cup & Handle: $PIINDThe Cup and Handle is arguably the most recognised bullish continuation pattern in technical analysis, valued for its ability to reflect a clean transition of ownership from weak hands to institutional strength.
With earnings due tomorrow, this pattern is currently signalling a critical accumulation phase.
Fundamental & Technical Fundamentals:
The Cup (Accumulation): The 'U' shape represents a consolidation of sentiment.
During this phase, investors digest previous highs, allowing the stock to build a firm base supported by underlying fundamental strength.
The Handle (Pre-Earnings Compression): The handle acts as a final pullback—a crucial stage where supply is tested.
In the context of upcoming earnings, this represents the market's 'wait-and-see' compression before the catalyst.
The Catalyst (Earnings): Tomorrow’s earnings announcement provides the volatility required to resolve the pattern.
We are looking for a move that validates the handle's support level, ideally accompanied by volume that confirms institutional confidence in the firm's forward guidance.
Risk Management: Earnings are binary events. The pattern provides the structural foundation, but the earnings report provides the fundamental spark.
Use the handle’s low as a strict invalidation level; if the report breaks this base, the technical setup is nullified.
Disclaimer: This analysis is for educational purposes based on technical patterns.
Earnings reports introduce significant volatility; ensure your position sizing accounts for the risk of a potential gap move.
KOTAKBANK: Reversing the Bear Trend🏦 🏦 🏦
The Thesis: Shaking Off the SlumpThe banking sector is finally pivoting from "restructuring anxiety" to "growth delivery."
While IT is currently suffering from "OpenAI disruption" fatigue, private banks like Kotak are finding a base.
Kotak’s Q4 results beat estimates by 10% with a profit of ₹4,027 crore, and its asset quality is remarkably clean with a Net NPA of just 0.25%.
Technical Analysis: The Rounding Bottom / Cup & Handle is forming a classic, a structural reversal.
The Launchpad: Support successfully held in the ₹343–₹348 zone.The Resistance: We are currently hammering against the ₹386.85 breakout level.
A daily close above this confirms the trend reversal.
The Gap Fill: The immediate high-velocity target is the orange line at ₹399.00. This is where May/Jun 400 CE position enters the "Gamma" zone.
The Trade Plan"Mahesh" Logic: We aren't just looking for a bounce; we are looking for the destruction of the 2-month downtrend.
LevelPrice PointActionEntry₹383.25 – ₹387.00Accumulate on the breakout of the purple resistance.
Stop Loss₹368.00Protect against a "fake-out" back into the rounding base.Linear Target₹428.00The structural recovery objective.
Log Target₹433.05
Short-Term Catalysts
RBI Resolution: The market is pricing in a resolution to the RBI's digital onboarding restrictions by June 2026, which would allow Kotak to restart its aggressive credit card growth.
Margin Stabilization: Net Interest Margins (NIM) showed a sequential recovery to 4.67% in Q4, proving the bank can defend its spreads even in a "persistent inflation" environment.
#KOTAKBANK #BankNifty #TradingView #Breakout #OptionsTrading #Finance2026
SILVER Accelerating to $95This is the full history of Silver.
With it's two GIANT Cup & Handle Patterns.
Big Patterns = Big Moves !!!
I find myself uncertain about the kind of world we would inhabit if Silver were to achieve the LOG projections in a chaotic disorderly manner.
We are undoubtedly stepping into a period of significant transformation across various sectors for global society in the coming decade or two.
Finance. Governance, Technology—let's seize the moment and take full advantage of the incredible opportunities available to us.
Centum Looks Ready for a Powerful BreakoutCentum Electronics is forming a strong cup and handle structure on the daily chart. After the long correction from the previous highs near 3040 , the stock gradually built a rounded base and recovered steadily from the 2044 low. Instead of seeing aggressive selling near the highs again, the price has started consolidating in a tight range just below resistance, which is usually a positive sign. The handle formation remains controlled, showing that buyers are still holding positions rather than exiting aggressively.
What makes the setup interesting is how price continues to respect the higher-low structure while staying close to the neckline area around 3066 . Normally, weak stocks get rejected hard near resistance, but here the pullbacks are shallow and buying pressure keeps returning quickly. The tight handle also suggests volatility is compressing, which often happens before a larger directional move.
The key breakout level to watch is 3066 . A strong close above this neckline could confirm the pattern and trigger fresh upside momentum. Based on the depth of the cup, traders can long for the following levels: 3350, 3685, and 3855.
As long as the price holds above the handle support zone after the breakout, the broader bullish structure remains intact. Until then, the stock is still in consolidation mode, but the overall setup continues to favor accumulation rather than distribution.
By @BrightRally_Research
Always do your analysis before taking any trade.
GTLB - End of long term downtrendGTLB appears to have finally put in a long-term bottom near its all-time low of $18, marking what could be the end of its extended bearish cycle. Price has since broken out of a Cup & Handle / Round Bottom pattern — a classic accumulation structure that signals a meaningful shift in trend.
The measured move from this breakout points to an initial target of $35, where price will face a significant confluence of resistance: the daily EMA 200 and a long-term descending trendline. This level will be the first major test of the new bullish structure.
Two scenarios & entry zones to watch:
Pullback entry: Price hits $35, faces resistance, and retraces toward $29–30 — offering a cleaner, lower-risk re-entry before the next leg higher
Breakout entry: Price pushes through $35 with conviction and sustains above it on a daily closing basis — confirming the trend continuation and opening the door to significantly higher levels
Invalidation: A breakdown back below the breakout zone would call the setup into question.