JIO FINANCIAL SERVICES (NSE: JIOFIN)Technical Confluence & Pattern Exhaustion
Textbook Downside Symmetry Completed:
Pattern 1 (2024): Head & Shoulders top near ₹394 broke the ₹310 neckline, cleanly hitting the projected linear target near ~₹226 (sweeping liquidity at the opening candle wick near ₹198).
Pattern 2 (2025–2026): Replica Head & Shoulders top near ₹340 broke the ₹290 neckline, hitting the linear target near ~₹240 with exact mathematical precision.
Full Liquidity Absorption & Double Bottom Base:
Downside targets from
Double Bottom
#IDUSDT Will Surprise the Market ?#IDUSDT
Sometimes, price action doesn't need complicated indicators to tell its story. A token's historical price behavior can reveal patterns worth watching!
Since April, ID has formed two bullish waves, both sharing a similar pattern: price returned to the same major support zone before launching into another upward move.
Now, price is approaching that same key support area at 0.0270 USDT.
Could we be witnessing the beginning of a third bullish wave?
Why Is This Zone Worth Watching?
The
W Marks the Spot: Pyth Network Retest Incoming!Price on CRYPTO:PYTHUSD may be falling, but this decline may just be a pullback to retest the breakout of a strong bullish reversal pattern!
CRYPTO:PYTHUSD has formed a Double Bottom pattern on the Weekly with strong indications like:
- Massive Volume increase on the 2nd Low
- RSI printing a Bullish Divergence
Sept. we received a breakout of the Confirmation of the pattern @ .06300 and I suspect we will see a retest of this level. If supported, this will be a great investment opportunity!
NATGAS, 4H Trading Analysis
NATGAS (Natural Gas) has formed a Double Bottom pattern on the 4H timeframe, suggesting a possible bullish reversal. Price is now developing a Change of Character (CHoCH), which could indicate a shift in market structure from bearish to bullish.
Rather than entering prematurely, wait for the CHoCH to complete and look for a confirmed Break of Structure (BoS) to strengthen the bullish outlook before considering a LONG entry.
MACD and RSI are providing additional confluence to support the anal
GOLD: Double Bottom Held, Gate Reclaimed. 4,094 Next?Hello traders,
Gold just did something worth noticing: it rallied 1.1% on a day the dollar went up.
📍 What the chart shows
• Weekly map from last week's range (high 4,190.42, low 3,975.65, close 3,995.81)
• The gate: weekly pivot 4,053.96
• R 0.184 zone: 4,085 – 4,105
• S 0.184 zone: 4,003 – 4,023
• S 0.382: 3,971.92
🔁 The double bottom
Friday's low was 3,975.65. Monday's low was 3,978.18. Both stopped just above S 0.382. Today gold pushed back above the gate and is trading around 4,061.
💵 M
AUDUSD: Double Bottom and Bullish Breakout🔹 AUDUSD technical analysis shows a recovery after a prolonged bearish trend, with price forming a potential double-bottom structure around the 0.6900–0.6935 support zone. Following the second rejection from support, buyers have pushed price above the descending trendline, suggesting a possible shift in short-term market structure. Price is currently consolidating near 0.7025, while the highlighted liquidity area around 0.7140–0.7155 represents a potential upside target if bullish momentum conti
BTCUSD:BULISH IDEAWhat you see on the chart (in trading / Smart Money Concepts + price action terms):
1. Overall structure
Double Bottom – A classic reversal pattern. Price formed two similar lows (marked with the purple curves), showing seller exhaustion and a potential bullish reversal.
2. Trend structure (Higher High / Higher Low)
HH (Higher High) – The previous higher high.
HL (Higher Low) – A higher low relative to the previous low.
These show that after the double bottom, price is starting to build a
Before Trusting a Price Target, Check the PathA chart pattern forms, a breakout occurs, and a theoretical price target is calculated. Everything appears to align. But does identifying a valid pattern necessarily mean that price has a clear path toward its projected destination?
One of the most common limitations of traditional chart pattern analysis is the tendency to focus on where price could go without paying enough attention to what might stand in its way.
Using 10-Year U.S. Treasury Note Futures (ZN) as an illustrative case study, we
EUR-AUD Free Signal! Buy!
Hello,Traders!
EURAUD is forming a double bottom within the uptrend, with a confirmed break above the local horizontal level needed to unlock bullish continuation toward 1.6239 as buyers take control.
------------------
Stop Loss: 1.6145
Take Profit: 1.6239
Entry: 1.6186
Time Frame: 2H
------------------
Buy!
Comment and subscribe to help us grow!
Check out other forecasts below too!
EUR/USD 1H: Crucial 1.123 Pivot Test — Breakout or Fakeout?⚡ Live price: 1.1229 (1H Candle)
💵 USD Pivot Retest & Double Bottom in Play | EUR/USD Facing Institutional Reversal Setup
📊 1. What the Chart Says (Price Structure & SMC)
• 🔴 Major Resistance / Pivot: 1.1230 (Previous structural Lower High & reaction origin where institutional supply entered)
• 🟢 Strong Support / Order Block: 1.1180 – 1.1200 (Verified 1H/4H Demand Zone where price printed a double-bottom structure)
• 🟩 Current Interaction: Testing the 1.1230 key pivot between the 50 EMA and 200
CRDO: Believe the Bottom Is In — Engulfing at EMA89Previoulsy shorted CRDO at 275 (See the attached post), now is the time to go long!
Story:
📊 The Pattern
Credo carved out a double bottom around $149 after a brutal drop of nearly 52% off its $308 top. This week printed a strong bullish engulfing candle — landing right on the rising weekly EMA89, which has acted as dynamic trend support through the entire 2023-2026 uptrend.
⚡ The Confirmation
Volume came in at 48.4M on the reversal week, well above the recent average — real participation show
GBPUSD Double Bottom Consolidation Bullish Breakout Setup
Executive Summary
The GBPUSD daily chart is revealing a prominent Double Bottom pattern around the major macro support level near 1.3180. Following a multi-week descent from late-August highs, price has stabilized within a tight horizontal consolidation range directly above this key floor. A bullish breakout above the consolidation box resistance (~1.3280-1.3300) would confirm the double bottom structure. The expected move targets an initial rally of roughly 130 pips (~1.0%) to Target Level
XAU (gold) started a bullish momentum up to 4280$ ??the price didn't sweep the liquidity at the bottom of 4066$ but at the 4H frame chart a strong bottom formed by a wick sweep the LIQ and third close body candle
also we can see a not completed double bottom pattern ( W ) formed with a divergence with the RSI
I will wait a conformation at 4100-4115 zone to go in buy position after the price full the FVG which formed after the imbalance of the price movment
( I will insert a pic in the notes)
good luck
stay hard
Adam and Eve Patterns: Tops & Bottoms👩🏫️ Adam and Eve Patterns: Understanding Double Tops and Bottoms
In technical analysis, not all double tops and double bottoms look the same. Some form sharp, narrow turning points, while others develop broader, rounded structures.
Adam and Eve patterns describe these differences in the shape of price peaks and troughs. Understanding these formations can help traders identify potential reversal structures and recognize when price action begins to confirm them.
Understanding the Four Patte
AMC: Daily Double Bottom Reversal & Debt Refinancing TailwindAMC is putting together a clean **Double Bottom** reversal pattern on the daily chart at the $2.88 level, following a prolonged consolidation phase off the lows.
Here is how I am breaking down both sides of this setup:
The Bullish Case (Reversal & Catalysts)
If buyers can establish momentum and trigger a breakout above the neckline, the measured move points toward a target of **$3.26**. Under the hood, the **CVD Divergence Lines v2** indicator highlights ongoing accumulation through the lows.
Aussie's Inflation Miss Sees EURAUD Bottom OutPrice on OANDA:EURAUD could be looking to push higher after the formation of what looks to be a Double Bottom pattern, lets break it down!
Price was unable to push down passed the 1.6080 area where we see two distinct Lows or valleys with price making a solid peak between the two around the 1.6220 area.
Today, we got a strong bullish push confirming the pattern and delivering the beginning of a Breakout and with a Breakout, we should expect a Retest!
This Retest will come once price makes i
$BTCUSDT Double Bottom BreakoutBTCUSDT is shown on the 1D timeframe, forming a visible double-bottom structure between February and September 2026.
The first bottom is near $59,000, while the second bottom is near the chart low of $57,461. The structure develops around a neckline/resistance zone near $83,500.
The current price is around $83,456, placing BTC near the key confirmation area. A sustained daily move above approximately $83,500 could confirm the breakout of the double-bottom structure.
The chart projects a targe
Bitcoin: D-Bottom as the Engine of a Potential Failure H and SMost traders will immediately focus on the large bearish Head & Shoulders structure visible on the chart. However, I believe the more interesting story is not the Head & Shoulders itself, but what happened after the pattern reached its completion area.
The key observation is that the recent Double Bottom did not form randomly.
The second bottom developed almost exactly at the projected completion point of the descending Head & Shoulders structure. In other words, the level where sellers were
NZDUSD TRADE PLANThere is bearish trend on 1H time frame. But I saw reversal pattern of falling Wedge, double bottom and have bullish divergence also. So may be trend will reverse from here but we still wait for confirmation till the break of last LH and will execute buy stop order then and trade accordingli.
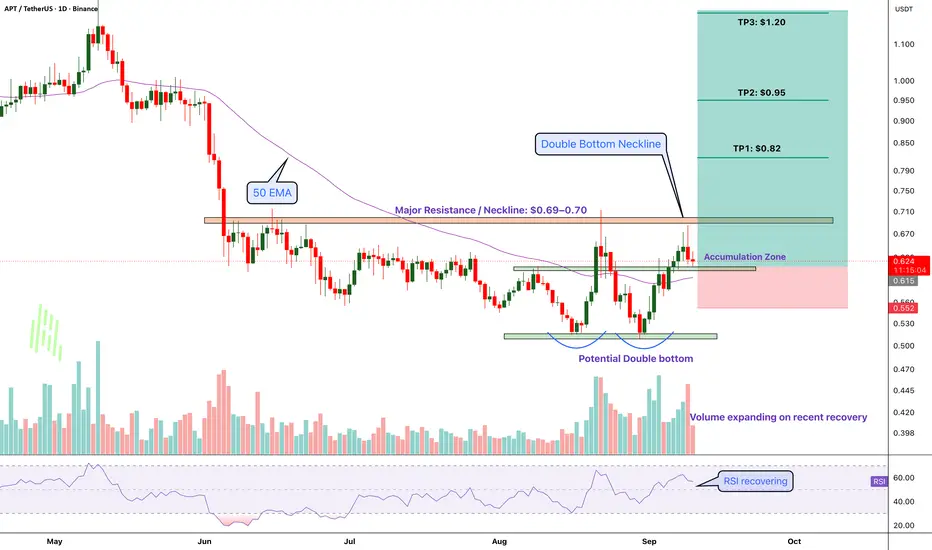
APT - Is the Long-Term Bottom Finally In?BINANCE:APTUSDT ( EURONEXT:APTOS ) has been pretty much forgotten for a while.After the long sell-off, though, the chart is starting to show a different picture. Price has built a base around the $0.50–$0.52 area and we’re now seeing a recovery back toward the key resistance zone.The level that matters most to me is $0.69–$0.70.That’s the neckline of the potential double bottom. A clean daily break and hold above this area would be the first real confirmation that the bigger trend may be changi