Crude Oil | When Structure Speaks Before the Move⏱️ Reading Time: About 2 Minutes
In our previous crude oil analyses, the goal was never to predict price or choose a fixed direction. Instead, we focused on understanding the structure the market was building.
One of the key possibilities we were tracking was the potential completion of a larger-degree Wave (II). Rather than simply taking a bullish or bearish stance, we waited for the market to reveal the character of its next move.
As the new movement developed, lower timeframes began showin
Economic Cycles
S&P 500 | Wave III: More Upside or a Major Pause?Reading time: about 2 minutes
This chart analyzes the long-term behavior of the S&P 500 through the lens of the Elliott Wave Principle.
In this count, the larger market advance from the 2009 low is viewed as an impulsive structure. The 2020 correction is labeled as Wave II, followed by the development of Wave III — a wave that often represents the strongest part of an impulsive sequence.
Bullish Scenario
In the bullish scenario, Wave III may not be complete yet, and its internal structure co
NQ Weekly Outlook: Mixed Again? | 14–18 Sep 2026The Fringe Cycles model read for 14–18 September suggests another mixed weekly structure for NQ, with weakness early in the week, a positive mid-week phase, and a return to negative bias into Thursday and Friday.
This outlook is based on the NQ Globex session, not just regular cash-session price action. Each daily bias applies approximately from 18:30 Eastern on the previous evening through 15:30 Eastern on the stated trading day.
Daily Model Expectations:
Monday, 14 Sep: Negative
Monday star
Episode 07 — The Moment the Market Revealed Its Language🎬 Mr. Nobody’s Chronicle
Season I — The History of Elliott Wave Principle
Episode 07 — The Moment the Market Revealed Its Language
⏱️ Reading time: ~3 minutes
“Sometimes, the greatest discoveries do not begin with an answer... but with the right question.”
After years of studying market charts, one question continued to occupy Ralph Nelson Elliott’s mind:
Why do certain market movements, despite appearing at different times and price levels, seem to share a remarkable similarity?
For many pe
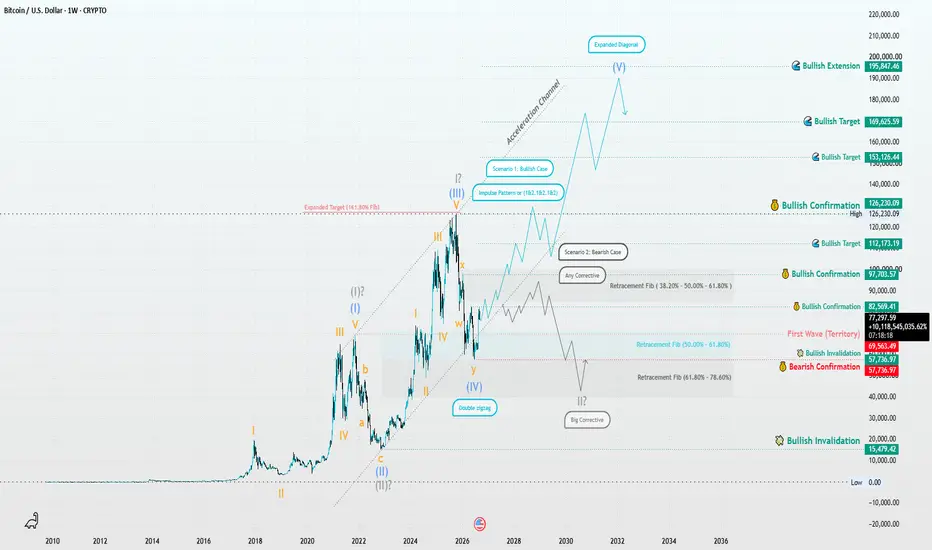
Bitcoin Weekly | Two Macro Paths⏱️ Reading Time: ~3 minutes
Hey everyone,
This weekly analysis takes a long-term look at Bitcoin’s structure. At this stage, I think it’s better to keep more than one interpretation open and let the market reveal more of its internal structure before choosing one count with confidence.
🟦 Scenario 1 | Leading Expanding Diagonal
One possible long-term interpretation is that Bitcoin’s entire macro structure could eventually be viewed as a Leading Expanding Diagonal on the linear chart.
If this
ETH/USD | The Hidden Structure of Wave VETH/USD | The Fifth Wave Reveals Its Structure
⏱️ Reading Time: ~2 minutes
Ethereum, at its largest historical degree, may still be completing a very large corrective structure. In this revised count, the main focus is on the behavior of Waves (I) through (IV) and the change in price personality that followed.
After Wave (IV), the lower-degree structure may be developing as an Impulse within Wave (V). An important point is that Wave III is shorter than Wave I, meaning Wave V can also be short
BNB | The Next Wave?⏱️ Reading Time: ~3 minutes
The weekly BNB chart, shown on a Linear scale rather than a logarithmic scale, is at a point where the larger structure still does not give us a definitive answer. However, two very different paths can be followed from the structure currently developing.
The key question here is not simply whether BNB will go up or down. The more important question is whether the current move is building a new impulsive wave or is still part of a larger corrective structure.
🟦 Scen
EURUSD: Long ideaWe can see a bull pennant formation in H4 Chart on EURUSD. There is a clear flag post (bull move) up, then price is now consolidating inside a falling wedge. The support i held below twice (two green arrows on the chart) and from the top, there is a descending trend line. The probability of such a setup breaking upwards is higher than breaking downwards. Invalidation would be the break of support line, supported by green arrows.
Disclaimer: This is for information purpose only and not an inves
SMCI: The server king returns. Cisco opens a second doorSuper Micro Computer NASDAQ:SMCI again looks far more interesting from a fundamental standpoint than the chart alone might suggest. After a prolonged downtrend, the stock is attempting to form a reversal structure, and price is now around $40.10. The main support zone sits in the $29 to $33 range. That remains the key area buyers must defend. Above, the first serious resistance zone is around $54.73 to $58.05. A breakout there could open the door to $68.05 and then $80.73. The all-time high i
ARC: Weekly VCP, Daily Launchpad. ⚛️HTF Context 🔭
ARC is building one of the cleaner higher-timeframe structures on my watchlist.
The weekly chart has spent months repairing its prior decline, then established a series of higher lows and began compressing beneath the key $0.083 to $0.084 resistance area. Volatility has contracted, volume has faded during the base, and price is holding above the rising weekly structure.
This resembles the early-stage behavior seen in many prior large-cycle winners: an extended repair phase
Dynamic Structural AnalysisTraders eventually discover two structural concepts: swing structure and internal structure. What often gets missed is that these two are not separate tools used side by side — they are one continuous, repeating cycle, and understanding the cycle is what makes structural analysis dynamic rather than a fixed set of lines on a chart.
The Break Starts the Discovery
Once a swing high or a swing low breaks, price enters price discovery. That price discovery move is internal structure — its own tr
Ethereum History rhymesPrice is compressed in a tight range between roughly 2,350 and 2,550 after the September impulse, and the obvious move is a push through the highs that takes the breakout liquidity, fails, and reverses back inside. From there I expect the market to come down and reset the FVG left behind by the impulse, roughly 1,900–2,220. That's not a failure of the move, that's the move getting properly filled.
The rhyme: identical sequence in May–June 2025. Impulse off the 1,492 low, unfilled gap, weeks of
The Market Broke The RuleFor years, traders have been taught a simple relationship: rising yields are bad for equities. Higher borrowing costs increase the discount rate applied to future earnings, financial conditions become tighter, and expensive growth assets can come under pressure. The relationship is real, but treating it as a mechanical rule is where the analysis starts to break down.
The recent market reaction provides a useful case study. U.S. Treasury yields moved sharply higher as inflation concerns, rising
Bitcoin (BTCUSD) — Falling Wedge Inside a Bigger Range, **Bitcoin (BTCUSD) — Falling Wedge Inside a Bigger Range, Targeting a Breakout Toward 81,200+ 🟠**
**Market Structure Overview:**
BTC exploded higher from the 76,000 zone, tapped just above 82,000, then pulled back into consolidation. Since then, price has been carving out a **falling wedge** — a series of lower highs and lower lows that are converging, which is typically a bullish continuation/reversal pattern rather than a bearish one.
**What's happening on the chart:**
🔹 **Falling Wedge Pat
Gold 1H | The Market Is Asking a Question⏱️ Reading time: ~2 minutes
Sometimes, a chart is more than just a chart.
If we look at it too quickly, we may see nothing more than a few candles moving up and down.
But if we slow down...
another question begins to appear:
What exactly is the market building?
On the 1H Gold chart, the recent move from the 4,697 high has created a meaningful bearish structure, while the market is now developing a movement that has not yet revealed its final answer.
We can follow a bullish scenario, where
Episode 06 — When the Wave Principle Reached the World🎬 Mr. Nobody’s Chronicle
Season I — The History of Elliott Wave Principle
Episode 06 — When the Wave Principle Reached the World
“A discovery, while it remains only in one person’s mind, still has a long journey before it can reach the world...”
In the previous episode, we came closer to one of the deeper ideas behind the Wave Principle.
A movement could be composed of smaller movements...
while that same movement could also be part of a larger structure.
A pattern within the pattern.
But
AVO (Mission Produce): The Star Alignment Taking PlaceIf you are looking for a fundamentally backed breakout play hiding in plain sight, NASDAQ:AVO needs to be on your radar.
Looking at the daily chart, the price action over the last year has been incredibly choppy, trapped in a volatile range between $9.50 and $15.50. However, beneath this frustrating structural choppiness, a massive accumulation phase is taking place, backed by serious fundamental catalysts and heavy institutional conviction.
Here is why NASDAQ:AVO is positioned for a major
Gold Breaks a Falling Wedge: Is $4,470 the Next Target?Gold ( OANDA:XAUUSD ) is currently trading near the key trading levels of $4,400 and $4,370.
From a classical technical analysis perspective, gold has formed a Falling Wedge Pattern and is now trading above its upper trendline, supporting a potential bullish reversal.
Can gold confirm this breakout and extend its recovery toward $4,470?
Technical Analysis
From an Elliott Wave perspective, gold appears to have completed a Double Three Correction(W-X-Y) inside the Falling Wedge Pattern.
The b
ENSO: 5H Balance Break, Retest Held, VAH Acceptance Next⚛️ Daily Chart 📈
The daily is the higher-timeframe roadmap here. As long as ENSO continues to hold its daily structure and avoids accepting back below the key breakout/support area, the 5H balance break has room to develop into a broader continuation move.
The 30m VAH is the immediate trigger, but the daily chart determines whether this is simply an intraday push or the beginning of a cleaner higher-timeframe expansion. A daily close holding above the breakout area would strengthen the bullish
BTC 2026 Bottom SnipingTarget circle of bear market end, derived from a combination of the four year cycle dogma for time, and my personal power law dogma for price (TV won't let me turn on the power law model for a published idea).
If the price action fails to hit the circle in time, I highly doubt BTCUSD will ever fall to those price levels again in the future.
I continue to see a higher low as the most likely marker of the end of the bear market. This higher low is a time-adjusted double bottom in my power law mo