Brent Crude Oil | Is Wave III Expanding?⏱️ Reading time: About 2 minutes
In our previous oil analyses, the focus has always been on one simple question:
What structure is the market building?
On the 2H Brent chart, the move developing from the major low continues to show an impulsive character. Price has now reached an area where the structure may provide much more information about the higher-degree wave.
In the bullish scenario, the current advance could be part of a higher-degree Wave III. If so, the internal structures should
Economic Cycles
Silver | When Structure Speaks, We Listen⏱️ Reading time: about 3 minutes
In our previous Silver analyses, we focused on identifying the first motive wave to the upside from the recent low — a structure that could develop into a five-wave impulse. After the latest movement, the main question is no longer simply “up or down?” but rather what degree does the current correction belong to, and is it still developing or already complete?
🟦 Scenario 1 | Bullish Case
In this view, the initial bullish structure remains important. The recent
DXY 2H | The Next Structure Will Define the Larger Path⏱️ Estimated Reading Time: About 2 Minutes
Following our daily DXY analysis, we are now moving down to the 2-hour chart to examine what the current movement may be building at the lower degree.
In the bullish scenario, if the recent correction has already completed, the market should now be developing a new Wave 1. Therefore, simply seeing price move higher is not enough. Price needs to break decisively out of the marked black boxes and then develop a valid motive structure.
If that happens,
DXY | When Structure Reveals the Dollar’s Next Path⏱️ Estimated Reading Time: About 2 Minutes
In this update, our focus is on the current DXY structure on the daily chart, where the market is still revealing the pattern following the recent decline.
From the higher-degree perspective, we continue to monitor two scenarios.
🟢 Bullish Scenario
If the current structure completes as a corrective pattern and the market then develops a valid motive structure, the probability of further DXY strength will increase.
A break of the marked levels could
Temporal Aspect of FractalityIn this publication, I would like to bring some clarity to the series of my unconventional analysis.
At this stage of my research I have no doubt that market's natural growth patterns can be defined by historic range and power exponents of Phi. Essentially, it's just two overall fib channels that cover structural boundaries of bullruns from ATH to new ATH mapped to bottom as 3rd coordinate. When we have angle of fibs derived from chronological highs, the ratios would cover the levels of oscillat
$MSTR: Weekly Crossback + Daily BNB1 + 65m 3 Bar Play⚛️HTF Context 🔭
NASDAQ:MSTR is building constructive multi-timeframe continuation structure. On the Weekly chart, price has put in a Wedge Pop and is now working through a Crossback. That is the first meaningful pullback and retest phase after the impulsive move, and it can create a strong continuation location if support holds.
The Daily is beginning to form a BNB1, showing that price is consolidating rather than immediately giving back the prior expansion.
LTF Structure 🧱
On the 65m,
Gold 1H | Let the Structure Reveal the Next Wave⏱️ Reading time: ~3 minutes
🟦 Scenario 1: Bullish Case
The bullish case does not necessarily require price to move straight higher.
After the recent move, the market may develop a sideways corrective structure and continue moving within the projected range. This would allow the correction to become more complex or time-consuming without necessarily invalidating the larger bullish structure.
Here, time, degree, and the character of the correction are important.
⬛ Scenario 2: Bearish Case
The
Crude Oil | When Structure Speaks Before the Move⏱️ Reading Time: About 2 Minutes
In our previous crude oil analyses, the goal was never to predict price or choose a fixed direction. Instead, we focused on understanding the structure the market was building.
One of the key possibilities we were tracking was the potential completion of a larger-degree Wave (II). Rather than simply taking a bullish or bearish stance, we waited for the market to reveal the character of its next move.
As the new movement developed, lower timeframes began showin
S&P 500 | Wave III: More Upside or a Major Pause?Reading time: about 2 minutes
This chart analyzes the long-term behavior of the S&P 500 through the lens of the Elliott Wave Principle.
In this count, the larger market advance from the 2009 low is viewed as an impulsive structure. The 2020 correction is labeled as Wave II, followed by the development of Wave III — a wave that often represents the strongest part of an impulsive sequence.
Bullish Scenario
In the bullish scenario, Wave III may not be complete yet, and its internal structure co
NQ Weekly Outlook: Mixed Again? | 14–18 Sep 2026The Fringe Cycles model read for 14–18 September suggests another mixed weekly structure for NQ, with weakness early in the week, a positive mid-week phase, and a return to negative bias into Thursday and Friday.
This outlook is based on the NQ Globex session, not just regular cash-session price action. Each daily bias applies approximately from 18:30 Eastern on the previous evening through 15:30 Eastern on the stated trading day.
Daily Model Expectations:
Monday, 14 Sep: Negative
Monday star
Episode 07 — The Moment the Market Revealed Its Language🎬 Mr. Nobody’s Chronicle
Season I — The History of Elliott Wave Principle
Episode 07 — The Moment the Market Revealed Its Language
⏱️ Reading time: ~3 minutes
“Sometimes, the greatest discoveries do not begin with an answer... but with the right question.”
After years of studying market charts, one question continued to occupy Ralph Nelson Elliott’s mind:
Why do certain market movements, despite appearing at different times and price levels, seem to share a remarkable similarity?
For many pe
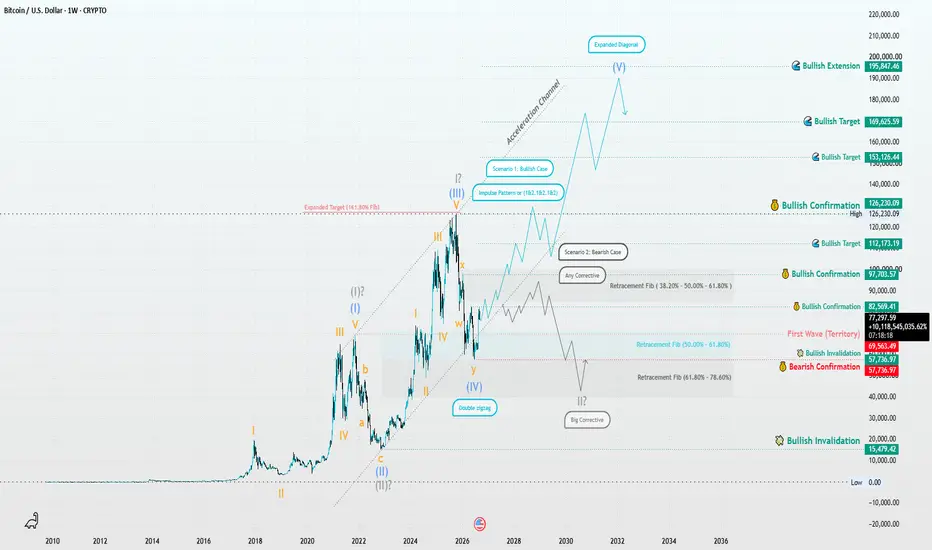
Bitcoin Weekly | Two Macro Paths⏱️ Reading Time: ~3 minutes
Hey everyone,
This weekly analysis takes a long-term look at Bitcoin’s structure. At this stage, I think it’s better to keep more than one interpretation open and let the market reveal more of its internal structure before choosing one count with confidence.
🟦 Scenario 1 | Leading Expanding Diagonal
One possible long-term interpretation is that Bitcoin’s entire macro structure could eventually be viewed as a Leading Expanding Diagonal on the linear chart.
If this
ETH/USD | The Hidden Structure of Wave VETH/USD | The Fifth Wave Reveals Its Structure
⏱️ Reading Time: ~2 minutes
Ethereum, at its largest historical degree, may still be completing a very large corrective structure. In this revised count, the main focus is on the behavior of Waves (I) through (IV) and the change in price personality that followed.
After Wave (IV), the lower-degree structure may be developing as an Impulse within Wave (V). An important point is that Wave III is shorter than Wave I, meaning Wave V can also be short
BNB | The Next Wave?⏱️ Reading Time: ~3 minutes
The weekly BNB chart, shown on a Linear scale rather than a logarithmic scale, is at a point where the larger structure still does not give us a definitive answer. However, two very different paths can be followed from the structure currently developing.
The key question here is not simply whether BNB will go up or down. The more important question is whether the current move is building a new impulsive wave or is still part of a larger corrective structure.
🟦 Scen
SMCI: The server king returns. Cisco opens a second doorSuper Micro Computer NASDAQ:SMCI again looks far more interesting from a fundamental standpoint than the chart alone might suggest. After a prolonged downtrend, the stock is attempting to form a reversal structure, and price is now around $40.10. The main support zone sits in the $29 to $33 range. That remains the key area buyers must defend. Above, the first serious resistance zone is around $54.73 to $58.05. A breakout there could open the door to $68.05 and then $80.73. The all-time high i
ARC: Weekly VCP, Daily Launchpad. ⚛️HTF Context 🔭
ARC is building one of the cleaner higher-timeframe structures on my watchlist.
The weekly chart has spent months repairing its prior decline, then established a series of higher lows and began compressing beneath the key $0.083 to $0.084 resistance area. Volatility has contracted, volume has faded during the base, and price is holding above the rising weekly structure.
This resembles the early-stage behavior seen in many prior large-cycle winners: an extended repair phase
Dynamic Structural AnalysisTraders eventually discover two structural concepts: swing structure and internal structure. What often gets missed is that these two are not separate tools used side by side — they are one continuous, repeating cycle, and understanding the cycle is what makes structural analysis dynamic rather than a fixed set of lines on a chart.
The Break Starts the Discovery
Once a swing high or a swing low breaks, price enters price discovery. That price discovery move is internal structure — its own tr
Ethereum History rhymesPrice is compressed in a tight range between roughly 2,350 and 2,550 after the September impulse, and the obvious move is a push through the highs that takes the breakout liquidity, fails, and reverses back inside. From there I expect the market to come down and reset the FVG left behind by the impulse, roughly 1,900–2,220. That's not a failure of the move, that's the move getting properly filled.
The rhyme: identical sequence in May–June 2025. Impulse off the 1,492 low, unfilled gap, weeks of
Gold 1H | The Market Is Asking a Question⏱️ Reading time: ~2 minutes
Sometimes, a chart is more than just a chart.
If we look at it too quickly, we may see nothing more than a few candles moving up and down.
But if we slow down...
another question begins to appear:
What exactly is the market building?
On the 1H Gold chart, the recent move from the 4,697 high has created a meaningful bearish structure, while the market is now developing a movement that has not yet revealed its final answer.
We can follow a bullish scenario, where