When the Waves Finally SpeakThe language of waves does not always speak to us immediately.
Sometimes, we see only five and three waves — simple, clean, and seemingly easy to recognize. But the real challenge begins when the market starts changing its structure.
This is where patience becomes part of the analysis.
We may recognize a possible pattern, but we should not become attached to it. The market must preserve that structure for the interpretation to remain valid. If the structure changes, our interpretation must ch
Fractal
Bitcoin: The 357-Day Cycle WindowBitcoin continues to show a remarkably similar late-cycle structure across multiple major cycles. In each case, price topped, sold off, consolidated, and then experienced a final capitulation leg near the end of a roughly 357-day window.
The current structure is once again approaching that same timing zone.
This doesn’t mean the market has to repeat perfectly, but the combination of time + structure suggests the final downside leg may still be ahead.
Silver | Follow the Structure, Not the Prediction⏱️ Reading Time: ~3 minutes
In this analysis, my goal is not to predict that Silver must move higher or lower. The goal is to examine the structure the market is actually building.
On the 2-hour timeframe, the previous advance toward 71.11 shows the characteristics of a motive structure, while the decline that followed may still be part of a higher-degree correction. At this stage, two main paths remain open.
🔵 Bullish Scenario:
If the current area marks the completion of the correction and p
Bitcoin: When We Can No Longer See the Shore⏱️ Reading Time: ~4 minutes
Sometimes, the best way to evaluate an analysis is not by looking toward the future, but by going back to the previous analysis and asking what the market actually did afterward.
In this study, I have updated my previous Bitcoin analysis.
The vertical red line is an important boundary in this review.
Everything to the left of the line is what we had available to us at the time of the original analysis.
Everything to the right is the path that was still in the fut
Bitcoin | Structure at a Major Decision Point⏱️ Reading Time: ~2 minutes
Bitcoin remains at a critical structural point, with two main scenarios still on the table.
🟦 Bullish Scenario
The current structure could be an extension of Wave 5, or potentially the beginning of a larger-degree Wave 3.
In the second interpretation, Wave 1 may already be complete and Bitcoin could be developing Wave 2 before another larger advance begins.
🟥 Bearish Scenario
The alternative is that the current structure is part of a larger-degree three-wave dec
XAU/USD 05 October 2026 Intraday AnalysisH4 Analysis:
-> Swing: Bullish.
-> Internal: Bearish.
Bias and analysis to remain the same as analysis dated 30 June 2026.
Price did not print bullish CHoCH to indicate bullish pullback phase initiation. Price instead printed a new low followed by a bullish CHoCH
Price is currently trading within and established internal range, however, I will continue to monitor price with respect to depth of pullback.
Intraday expectation:
Price to trade up to either premium of internal 50% EQ, or
Episode 10 — When a Wave Grew Within Itself🎬 Mr. Nobody’s Chronicle
Season I — The History of Elliott Wave Principle
Episode 10 — When a Wave Grew Within Itself
⏱️ Reading Time: ~3 minutes
“Sometimes, a wave grows so large that we can no longer see it as just a simple wave.”
In the previous episode, we followed Ralph Nelson Elliott as he began drawing boundaries around the structures he was discovering.
He was no longer simply watching the market move.
He was trying to understand how those movements were built...
And what happened w
7 Years Later, I Don’t Predict Ethereum — I Read Its Structure
In previous ETH updates, we kept following one simple question:
Is the larger corrective structure still developing, or is the market already beginning a new impulsive move one degree higher?
What we can see today on the Daily chart is interesting because part of the structure we discussed in previous analyses has now become clearer through price development.
The move from the area around 1,500 can still be examined as a developing impulsive structure, with 1–2 and 3–4–5 sequences appearing
NQ: Weekly Recap and the Map for the Week of Oct 5Week of Sep 28 to Oct 2 on the 1h, then the map for next week.
THE WEEK
Monday's low held all week. Every high and low after it printed at a level that was already on the chart.
Monday: sold from the weekend gap. The low at 30,356.75 swept the Sep 24 low into a stacked 4h and 1h FVG. ES and YM did not take their own lows. SMT.
Tuesday: retested the same 4h FVG and held 15.50 above Monday's low while ES and YM broke theirs. Capped under the 4h bearish FVG. Inside day.
Wednesday: higher low at
ETH update 02.10.26 - 24h Market Forecast (Wavelet Decomp.)# Ethereum — 24H Forecast & Reconstructed Price Analysis | October 2
Ethereum is showing a pattern broadly similar to Bitcoin.
The reconstructed/denoised price has tracked the subsequent real price movements reasonably well. The relationship between the reconstructed and actual prices around the September 28 decline was particularly notable.
Before the decline, the reconstructed price was significantly below the actual market price, indicating that the market price was potentially elevated re
BTC update 02.10.26 - 24h Market Forecast (Wavelet Decomp.)# Bitcoin - 24H Forecast & Reconstructed Price Analysis | October 2
The reconstructed/denoised Bitcoin price has been tracking the subsequent real price movements reasonably well.
Until around September 28, the reconstructed price was significantly below the actual market price. This suggested that Bitcoin was potentially overextended relative to the underlying reconstructed price and could move lower.
That scenario was confirmed on September 28, when the price dropped significantly.
After t
XAU/USD 02 October 2026 Intraday AnalysisH4 Analysis:
-> Swing: Bullish.
-> Internal: Bearish.
Bias and analysis to remain the same as analysis dated 30 June 2026.
Price did not print bullish CHoCH to indicate bullish pullback phase initiation. Price instead printed a new low followed by a bullish CHoCH
Price is currently trading within and established internal range, however, I will continue to monitor price with respect to depth of pullback.
Intraday expectation:
Price to trade up to either premium of internal 50% EQ, or
ASTER: Volume Picks Up, Watching for a Break Above $0.78BINANCE:ASTERUSDT stays on my watchlist for now. Daily trading volume has picked up compared with the summer consolidation, but price remains inside the triangle. Higher volume alone does not confirm the breakout direction.
I would consider a long only after a confirmed break above $0.78–$0.782 : a daily close above the zone, ideally followed by a successful retest.
My take-profit area is around $0.90, ahead of the broader resistance zone near $0.91–$0.98. That offers roughly 15% upside fr
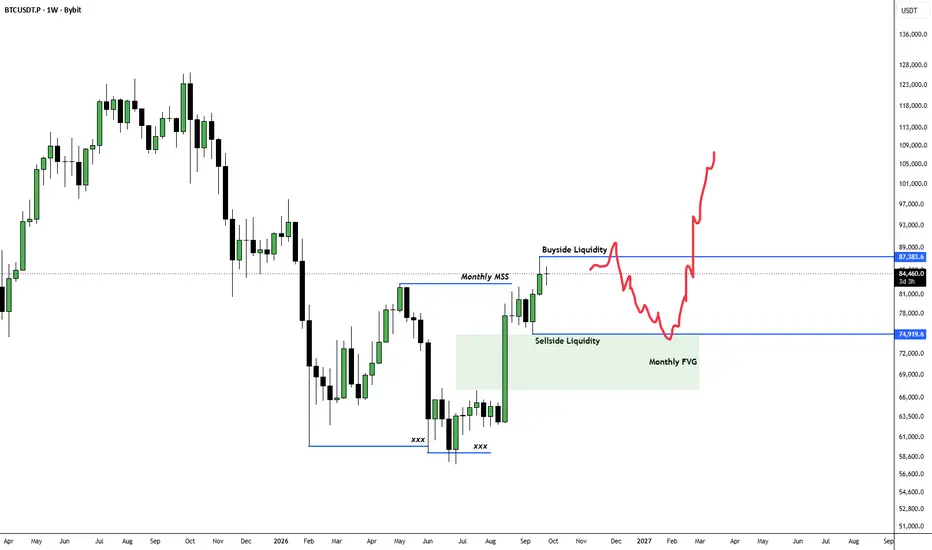
BTC HTF IDEAThis is the zone where Institutions would like to DCA.
So we could see atleast see 2 months of chop here.
- First we take out buyside liquidity and trap longs.
- Then flush the longs out while institutions build their orders through downtrend and take out Sellside liquidity.
- Fill the Monthly FVG and then start the journey to new ATH by 2027.
1) Monthly MSS
2) Multiple weekly close above 50sma on weekly
These two hint that the bear market is over.
XAU/USD 01 October 2026 Intraday AnalysisH4 Analysis:
-> Swing: Bullish.
-> Internal: Bearish.
Bias and analysis to remain the same as analysis dated 30 June 2026.
Price did not print bullish CHoCH to indicate bullish pullback phase initiation. Price instead printed a new low followed by a bullish CHoCH
Price is currently trading within and established internal range, however, I will continue to monitor price with respect to depth of pullback.
Intraday expectation:
Price to trade up to either premium of internal 50% EQ, or
WTI Crude Oil | Testing a Nested Wave III Structure⏱️ Reading Time: About 2 Minutes
For this update, I am focusing only on the bullish scenario and allowing price action to show us whether this structure can continue to develop.
One possibility I am currently tracking is a sequence of three nested 1–2 structures across different degrees. If this interpretation is correct, the market may be building the early stages of a larger Wave III, with each lower-degree structure preparing the next impulsive advance.
The recent decline is important, but
Bitcoin 4H | Bullish Structure & The Golden Possibility⏱️ Reading Time: ~3 minutes
Hey everyone,
In this update, I’m focusing only on the bullish scenario for Bitcoin, looking at it from two different structural perspectives.
At first glance, the larger-degree structure suggests that a motive pattern is developing or approaching completion. If this interpretation is correct, then after the current advance, I would expect the market to develop at least a three-wave corrective structure.
That’s why I’ve mapped the potential correction in blue. I s
GME's W PatternIts an overlay. The big macro pattern is from before 2019 to 2008 (first peak). This Pattern is also similar to the 2024 and now. All come down to about now. As always I have no idea but this is provocative and keeps you all going!
Best Regards and NFA
HAVE FUN AND ALWAYS:
OPEN TO DISCUSS :)
Bitcoin 4H | Two Paths, One Structure⏱️ Reading Time: ~3 minutes
Hey everyone,
In this 4H Bitcoin update, I’m looking at two main scenarios. Both are based on the rules and guidelines of the Elliott Wave Principle, but each one suggests a different structural path for the market.
🔴 Scenario 1 | Bearish Case
In the bearish scenario, the assumption is that the recent bullish structure has been completed and the market is now developing a higher-degree corrective pattern.
The current structure could develop into an Expanded Flat,
XAU/USD 30 September 2026 Intraday AnalysisH4 Analysis:
-> Swing: Bullish.
-> Internal: Bearish.
Bias and analysis to remain the same as analysis dated 30 June 2026.
Price did not print bullish CHoCH to indicate bullish pullback phase initiation. Price instead printed a new low followed by a bullish CHoCH
Price is currently trading within and established internal range, however, I will continue to monitor price with respect to depth of pullback.
Intraday expectation:
Price to trade up to either premium of internal 50% EQ, or
Silver | Behind the Structure of Wave IV⏱️ Reading Time: ~3 minutes
On the 4-hour timeframe, Silver remains at a point where the structure has not yet revealed its final path. The recent decline may still be part of a more complex correction, and in the bearish scenario, it could continue developing as a Double Zigzag.
🔵 Bullish Scenario
If Silver avoids a deeper decline from the current area and instead develops a valid motive structure, the picture changes. In that case, we could see at least three bullish waves at a larger degre