XAUUSD: Sell on rallies on July 8thThe trading market is awaiting the release of the Federal Reserve's June meeting minutes, which may provide new direction for gold prices. If the Fed signals a more dovish stance, a weaker dollar and declining real yields could drive gold prices higher again; however, if renewed concerns about inflationary pressures arise, the upside potential for gold prices may be limited.
The US dollar index rebounded after hitting a low, causing gold to rise initially before falling. During the US session, gold surged before retreating, breaking below $4100. The daily chart closed lower, with prices returning to the 7-day moving average around 4095. Prices broke below the Bollinger Band's middle band, and the RSI indicator is adjusting below the 50 level. The 10-day and 7-day moving averages are converging. On the 4-hour chart, the sharp drop broke through the 4100 level and touched the lower Bollinger Band around 4092. Moving averages are crossing downwards, and the RSI indicator has broken below the 50 level and turned downwards. On the hourly chart, moving averages are crossing downwards, and the Bollinger Bands are widening downwards, with prices trending downwards along the lower half of the band. With the strengthening US dollar, gold and silver are facing renewed resistance and falling. Intraday trading should focus on selling on rallies.
Resistance levels: 4125/4130/4148/4170; Support levels: 4083/4062/4033/4000.
My recommendations:
BUY: 4060-4070, SL: 4040, TP: 4130-4150;
SELL: 4150-4160, SL: 4180, TP: 4100-4070;  Short
Short
 Long
Long
Stay firm on buying the dip!Gold prices are currently in a technical correction phase, undergoing a pullback and consolidation within a range. The overall bullish trend remains intact and has not been broken. Once this round of correction and bottoming is completed, a second round of upward movement will begin. In the short term, the price is expected to maintain a range-bound movement, while the long-term bullish holding logic remains unchanged.
Key support levels: 4120~4116, 4080; Core resistance levels: 4200, 4230. Ahead of the release of the Fed meeting minutes on Wednesday, market liquidity tends to tighten, and the probability of a one-sided market trend is low. The trading strategy should focus on buying on dips.
Trading Recommendations:
Consider placing long orders within the 4120-4116 range, with a stop-loss at 4118 and targets at 4168-4200.
If the price retraces deeply to the 4080-4075 support zone, consider adding to long positions in batches. Short 
Comprehensive Short-Term Market Analysis of BTCCurrently, the price of BTC is trading below the 20-day moving average of 62602 and the 50-day moving average of 65552. Both moving averages are turning downwards in tandem, and the bearish alignment of the moving averages confirms a daily downtrend structure.
The daily RSI value is 45.88, which is not in the oversold zone, indicating that the bearish momentum has not completely exhausted and there is room for a second downward test. The MACD lines are below the zero axis, and the green bars are slightly converging, which only indicates that the decline has slowed down, but there is no clear reversal signal.
The Bollinger Bands are narrowing, compressing the fluctuation range. The price is running close to the lower Bollinger Band, and the range is locked at 61200-64000.
Short-term moving averages are intertwined and converging, making the direction unclear. Only a breakout above the upper trendline with increased volume can reverse the weakness and turn the market stronger; a breakout below the lower trendline with increased volume will trigger a new round of deep retracement.
Short sellers are eager to sell at higher prices, and the rebound is a technical correction rather than a reversal.
The 1-hour 200EMA moving average at 62213 almost coincides with the current price, serving as a key level for determining whether the market is bullish or bearish this hour; a close above this level would indicate a slight rebound, while a break below would directly test the intraday low support.
The short-term RSI has entered a low-level consolidation phase, which could trigger a small oversold rebound at any time. However, the rebound strength is strongly suppressed by the moving average above, making it unsuitable for chasing the rise.  Short
Short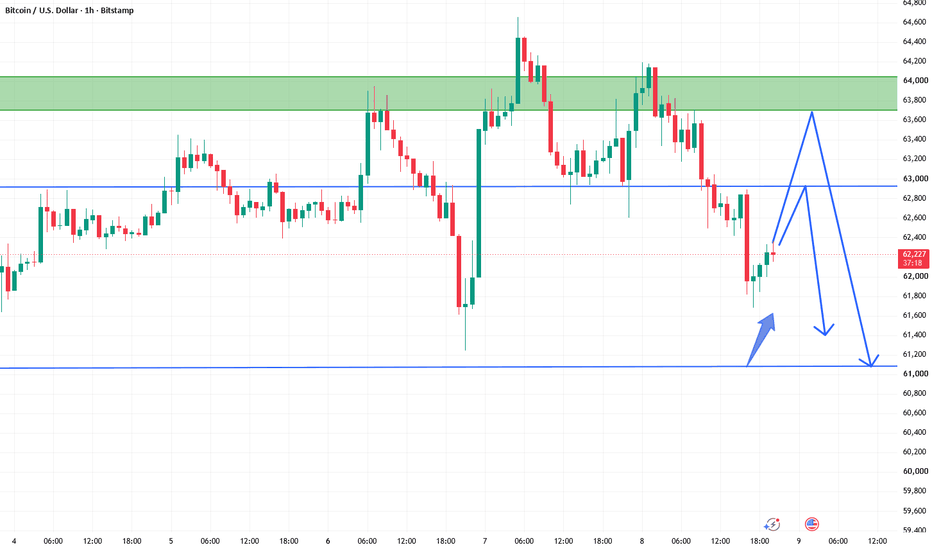
Short 
Long 
Gold Spot / U.S. Dollar — 1H Bullish Pullback Idea | July 06, 20Gold Spot / U.S. Dollar — 1H Bullish Pullback Idea | July 06, 2026
Symbol: XAUUSD / Gold Spot
Timeframe: 1H
Chart Date: July 06, 2026
Gold is currently trading in a bullish structure after a strong upside move. Price has already pushed close to the previous week high area, but I am not interested in chasing the move from here.
My main expectation is that price may first give a deeper pullback before continuing higher. The chart is showing possible downside liquidity around the previous day low and previous week equilibrium area. If price moves down into that zone, sweeps liquidity, and then forms a clean bullish reaction, that can create a better long opportunity.
The idea is simple:
Gold may pull back first to rebalance the move, collect liquidity, and then continue toward the marked higher-timeframe target.
For confirmation, I want to see:
Price pulls back toward the marked liquidity area
Sell-side liquidity sweep
Bullish reaction from the discount zone
Bullish dealing range / FVG formation
Continuation toward the upside target
I do not want to buy in the middle of the range. The better trade can come after patience, liquidity sweep, and confirmation.
Patience pays. Let Gold come to the right area first, then look for the clean setup. Long 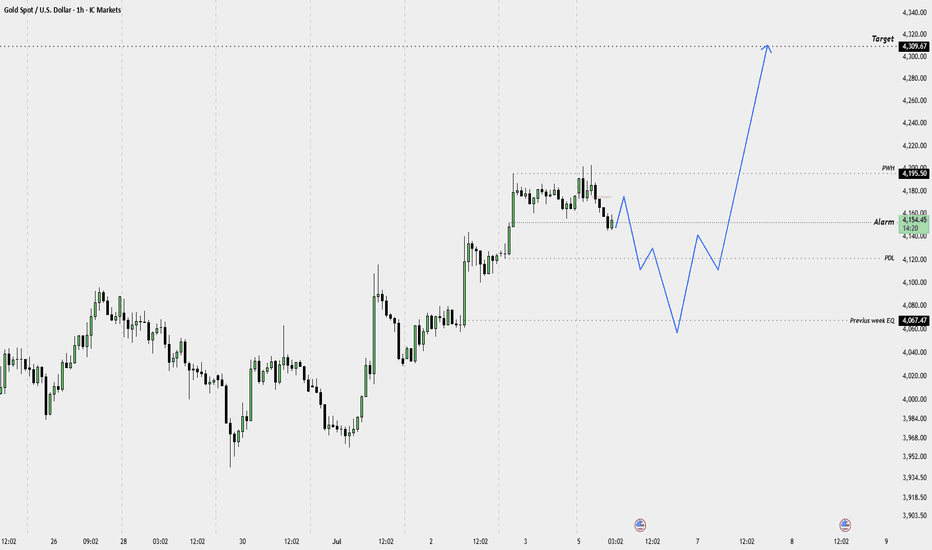
 Short
Short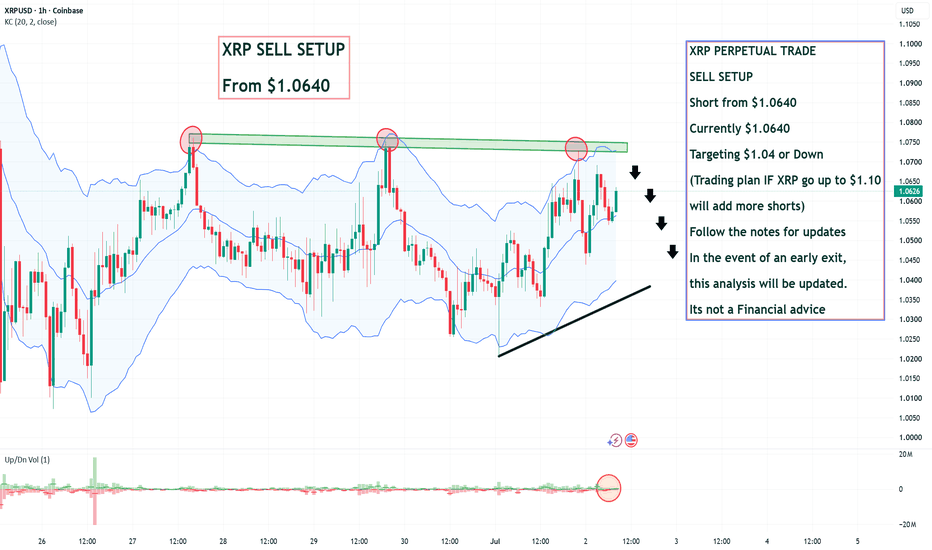
Long 
| USDCAD | SHORT | + 3% USING DXY CONFLUENCE 📈| Q3 | W28 | D6 | Y26 |
📊| USDCAD | SHORT | + 3% USING DXY CONFLUENCE
💡| FRGNT DAILY CHART ANALYSIS |
This forecast is built using an advanced adaptation of Smart Money Concepts, with a structured and disciplined approach:
• Marking Key Points of Interest (POIs) on Higher Time Frames (HTFs) 🕰️
• Defining a clear, controlled trading range from those zones 📐
• Refining entries on Lower Time Frames (LTFs) 🔎
• Waiting for confirmed Break of Structure (BoS) before execution ✅
This process ensures precision, removes emotional decision-making, and keeps me aligned with the overall market narrative.
💡 Core Philosophy
“Capital management, discipline, and consistency create longevity.”
A strong risk-to-reward model, paired with high-probability execution, is the foundation of sustainable trading 📈🔐
⚠️ Understanding Losses
"Losses are part of the game" — a mathematical certainty 🎲
They don’t define performance. Nor do they define you as a Trader.
They are managed, reviewed, and used as evidence for growth 📊
🙏 Final Note
Appreciate you taking the time to review today’s forecast.
Stay disciplined 🎯
Protect your capital 🔐
— FRGNT 🚀📈
📌 Disclaimer
This content is provided for educational purposes only and does not constitute financial advice.
It reflects my personal approach to the markets — a tested framework that has supported my own journey toward consistent profitability in currency trading.
Please understand that any forecasts shared are not financial advice. I will be looking for confirmation in line with my setup model and specific entry criteria from the key areas identified on the chart.
All analysis, whether presented via image or video, is shared strictly for educational insight and is not intended to breach any TradingView House Rules.
FX:USDCAD US30 1H: Trapping the Channel Buyers (Bearish Breakdown Setup)1. Market Context
On the 1H chart, US30 is trading within a well-defined ascending parallel channel. After a sharp rejection from the channel's upper boundary around 53,279.9, the price collapsed rapidly and is currently consolidating right above the critical ascending trendline support and local horizontal level at 52,793.7.
2. Sentiment & Price Trap Analysis
• The Retail Buyer Trap: Retail traders are aggressively opening long positions at the touch of the ascending trendline support (marked "Buyer"), expecting a typical bullish bounce back toward the upper channel limit. This heavy retail buying behavior has clustered a massive pool of sell-stop liquidity (stop losses) directly beneath the 52,793.7 support floor.
• The Breakdown Trigger: Institutional algorithms are likely keeping the price suspended temporarily to induce more retail buyers into the trap. Once the accumulation of long positions is complete, a decisive break below the 52,793.7 support will trigger a domino effect of stop-loss market orders (selling pressure).
• The Downward Expansion: The forced liquidation of trapped buyers will rapidly accelerate the downward momentum, driving the market straight into the deeper liquidity pools and structural support zones at 52,307.5 and 51,821.3.
3. Trade Setup
We target a high-probability short entry on the confirmed breakdown of the trendline support to capitalize on the trapped buyers' liquidation momentum.
• Entry: 52,793.7 (Selling the confirmed breakdown of the trendline and local support)
• Stop Loss (SL): 53,279.9 (Placed safely above the recent swing high/consolidation top)
• Take Profit 1 (TP1): 52,307.5 (First major horizontal support zone)
• Take Profit 2 (TP2): 51,821.3 (Ultimate target / lower structural expansion level)
• Risk-to-Reward Ratio (R:R): Approx 2:1 (Calculated based on TP2)  Short
Short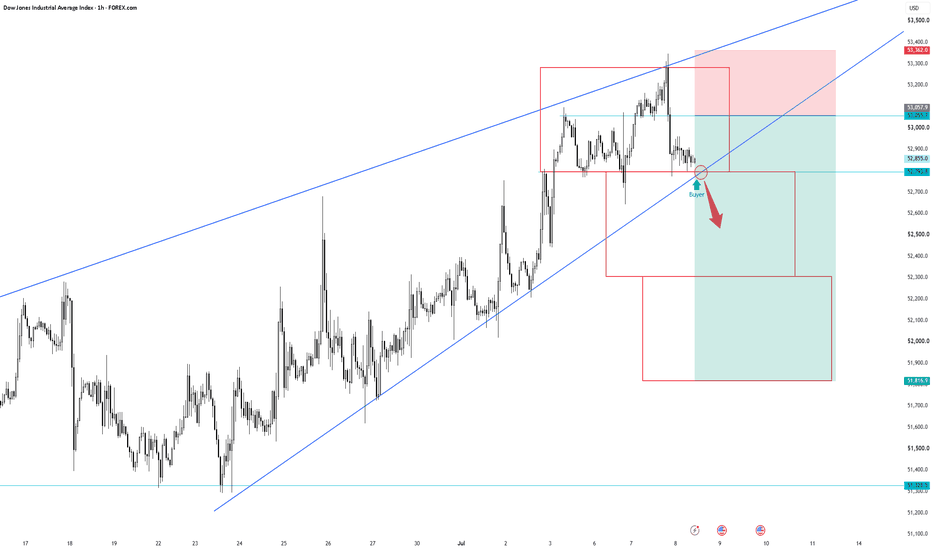
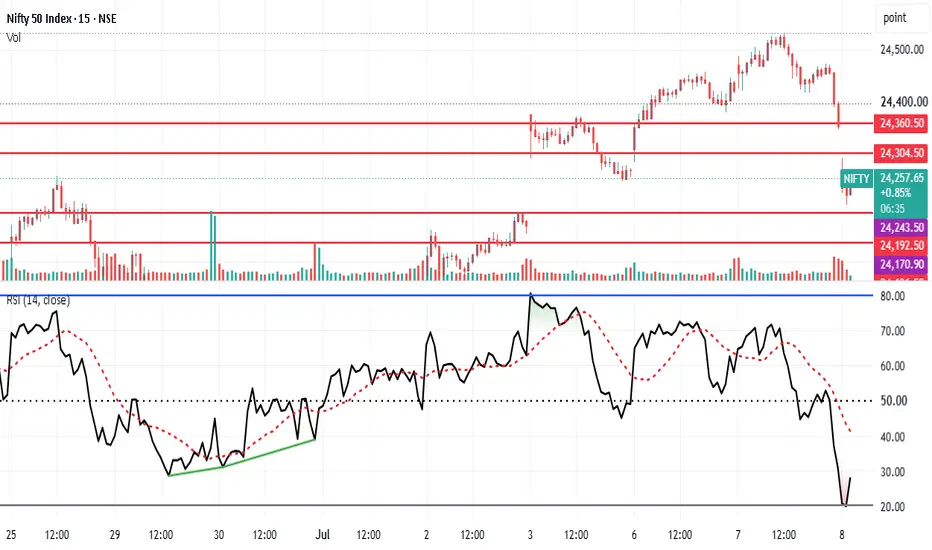
NIFTY SENTIMENT ANALYSIS FOR 08/07/2026# NIFTY | Gap Down, But Is It Really Bearish? | Time + Price Analysis | 08 Jul 2026
Today's session began with a noticeable gap-down opening, and naturally, the first reaction from most traders was to turn bearish.
My model disagrees.
A gap is only the opening price.
The real question is whether the market accepts lower prices or rejects them.
Yesterday's analysis gave me more confidence in this framework. The market respected the projected behaviour, decision zones, and sector leadership with remarkable precision. The objective isn't to predict every candle—it's to identify where probabilities shift.
## Market Sentiment
🟢 Primary Bias: Strong Bullish
⚠️ Hidden Character: Bullish + Trap / Conflict
This combination suggests that while the broader trend remains constructive, intraday volatility and liquidity sweeps are still possible. Instead of chasing the first move, I'm watching how the market responds after absorbing the opening weakness.
## Key Levels
🟣 Opening Anchor: 24,243.50
🔴 Resistance 1: 24,304.50
🔴 Resistance 2: 24,360.50
🟢 Support 1: 24,192.50
🟢 Support 2: 24,170.90
🟢 Major Support: 24,136.50
## Time Anchor
⏰ 12:40 PM IST
This is the decision window I'll be monitoring closely.
If buyers reclaim and sustain above the Opening Anchor after this time, today's gap-down could simply become a liquidity event before continuation.
Failure to do so would indicate that sellers are still in control.
## Sector Leadership
🥇 Banking
The Banking sector remains my preferred area to monitor for leadership. If the bullish thesis is correct, financials should participate before the broader market follows.
## Trading Plan
✔ Don't trade the gap.
✔ Trade the market's reaction to the gap.
✔ Respect the Opening Anchor.
✔ Let price confirm before committing.
## Final View
The market opened weak.
That doesn't necessarily mean the day will finish weak.
Sometimes the opening creates fear.
Sometimes fear creates opportunity.
Today isn't about predicting direction.
It's about identifying when the market changes character.
---
💬 What do you think?
Will NIFTY reclaim 24,243.50 and turn today's gap-down into a bullish recovery...
or is this the beginning of a deeper correction?
Share your analysis below. I enjoy reading different market perspectives.
If you found this analysis valuable, don't forget to Boost 🚀 and Follow for daily Time + Price market intelligence.
Educational purpose only. Not investment advice.  Short
Short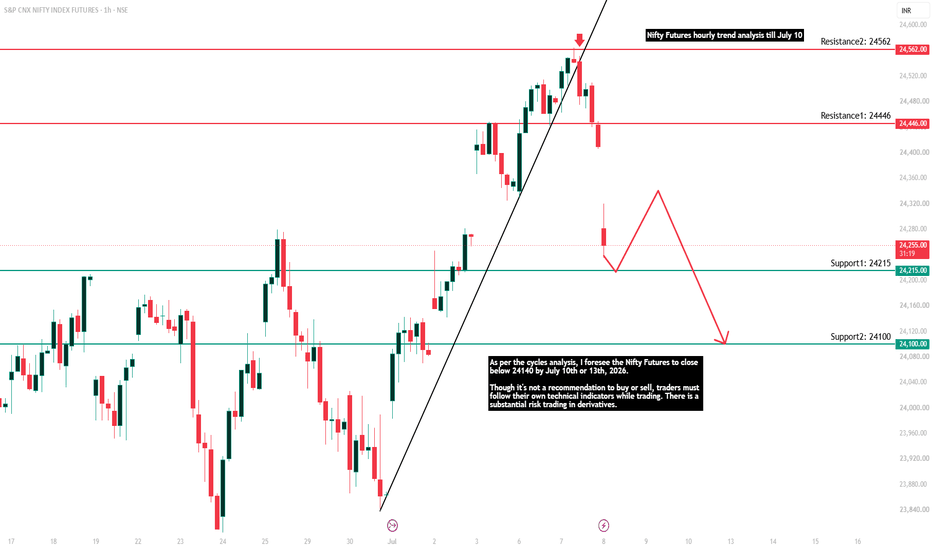
Long 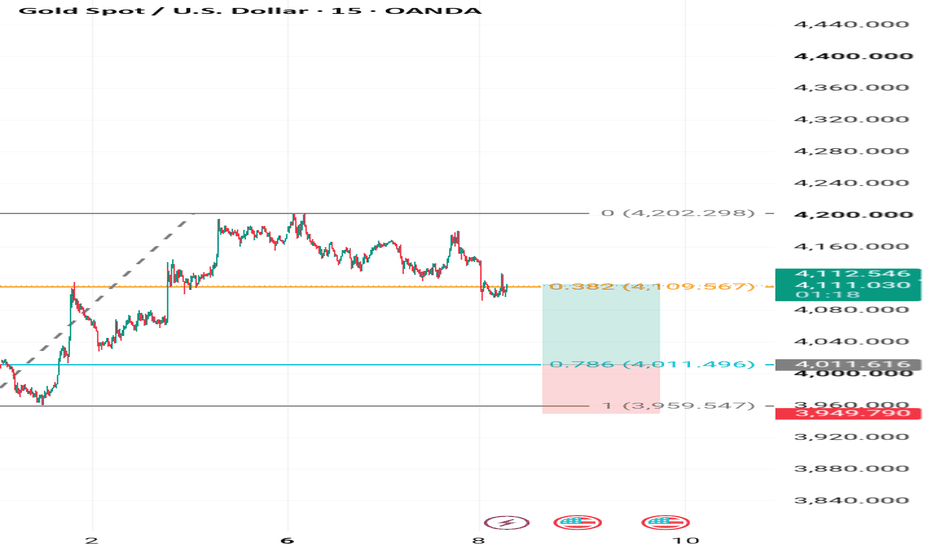
 Long
Long
Long 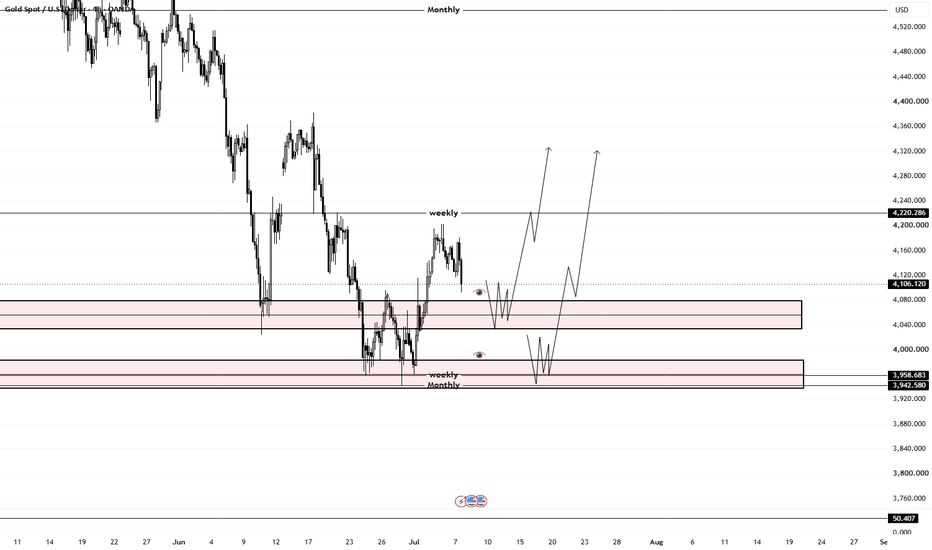
 Long
Long