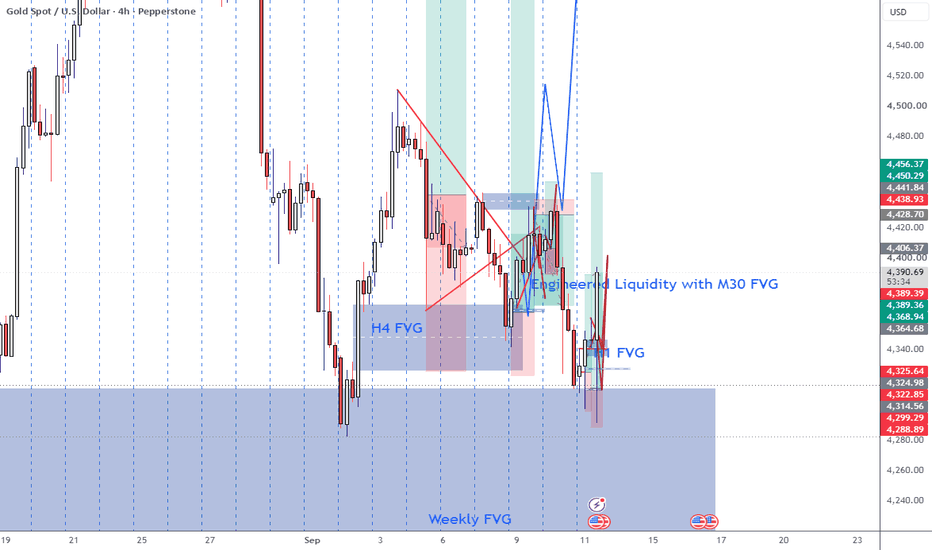
XAUUSD (Gold) – Bullish Support Bounce🟢 XAU/USD Buy Signal
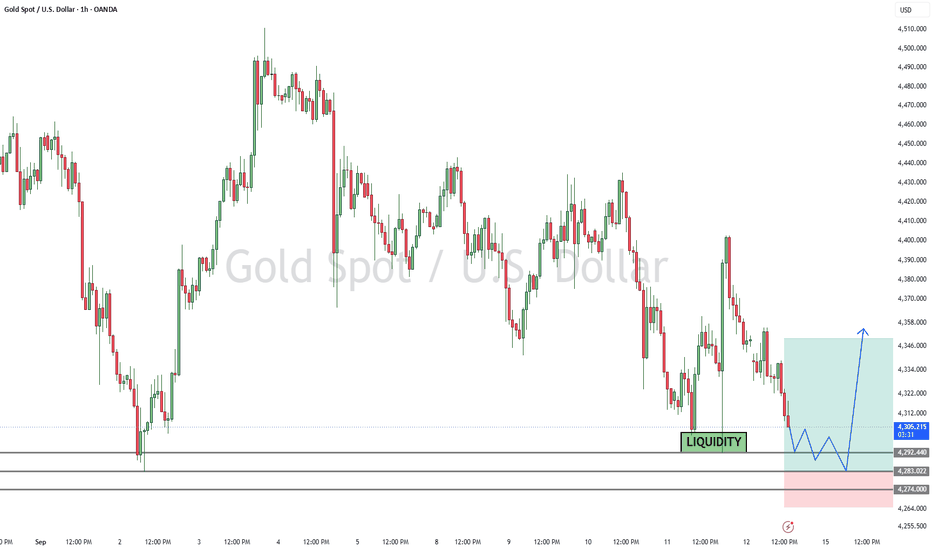
Buy Zone: 4283 – 4273
Stop Loss: 4265
Take Profit 1: 4290
Take Profit 2: 4310
Take Profit 3: 4350
📚 Educational Market Idea:
Gold is approaching the 4283–4273 buy zone, which may act as a potential support area. Traders should wait for bullish confirmation, such as a strong rejection candle, bullish engulfing pattern, or a break above a nearby short-term resistance before entering.
If buyers defend the zone and price maintains bullish momentum, the move could target 4290
Gann
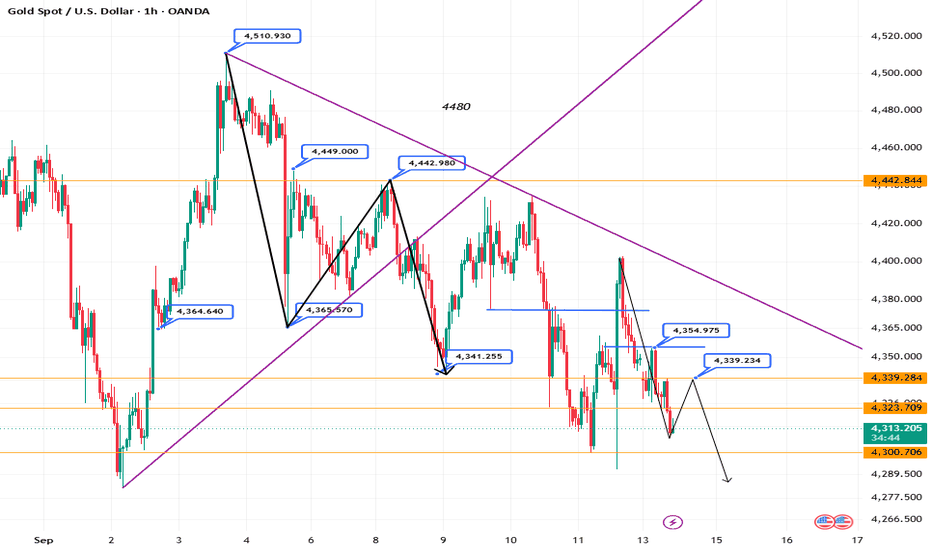
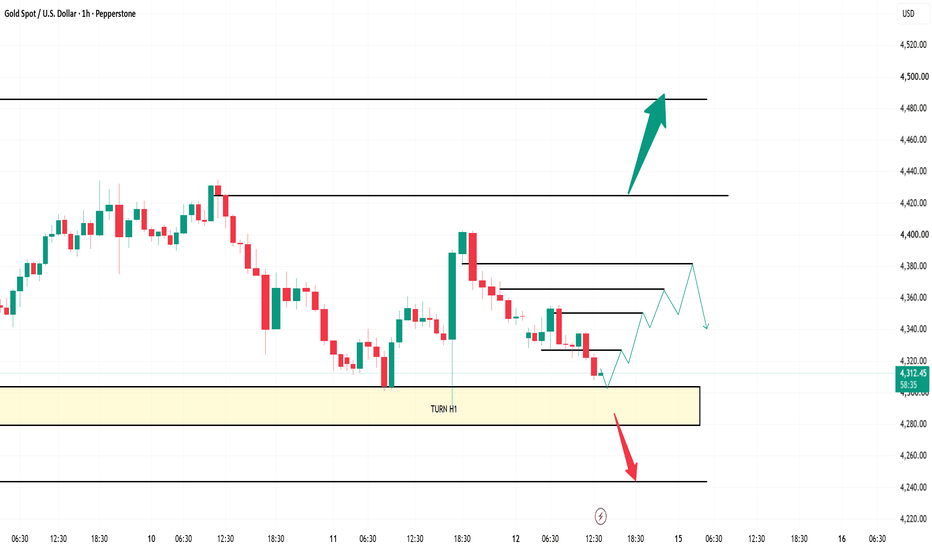
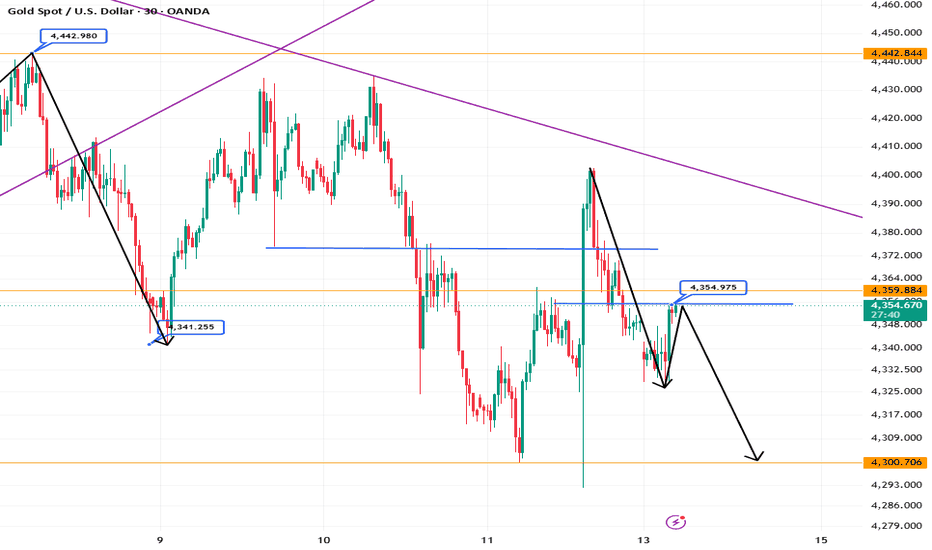
Gold prices will continue to fall.On the 4-hour chart, the market is seeing a tug-of-war between bulls and bears, with the rebound lacking strength. Key short-term support lies at $4,300, with strong support at $4,260; initial resistance is at $4,345, with strong resistance at $4,375. If the price stabilizes above $4,345, the potential for a short-term rebound opens up, targeting $4,375; conversely, if it falls back below $4,300, the bearish trend will resume, likely testing the $4,260 level. Strategy for the NY session: priorit
XAUUSD – Sideways Climb, Target 4,381🔶 XAUUSD – "FRESH WEEK SIDEWAY": NO "BOMB" NEWS TODAY, LEO HUNTS THE 4,303 DIP!
Leo | 14/09/2026 (Monday) – M15
🌍 REALTIME MACRO
Folks, fresh week, US economic calendar is empty today – no CPI, no NFP, no FOMC. But don't get complacent: FOMC rate decision this Wednesday (16/09) is the real "bomb." Market is split ~46% expecting 25bp hike, ~52% expecting hold – Leo leans toward Fed holding + less hawkish as inflation is cooling.
📌 Snapshot:
Gold spot: 4,316.91, session range 4,322 –
BRIAN XAUUSD – GOLD HOLDS VALUE, FED DECISION MAY TRIGGER THE BRIAN XAUUSD – GOLD HOLDS VALUE, FED DECISION MAY TRIGGER THE BREAK
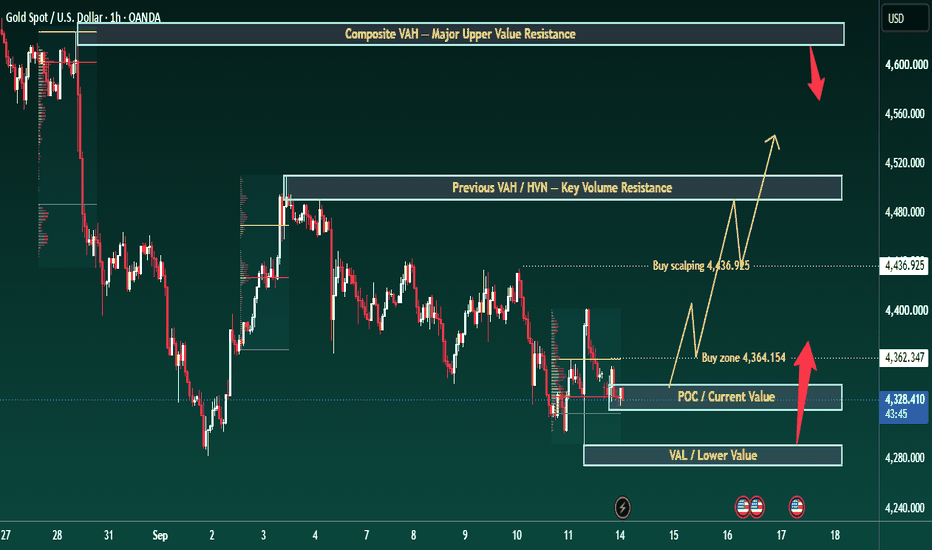
Gold starts the new week under pressure around 4,330 - 4,340 after failing to build a strong recovery from last week’s lower value area.
The macro background is still heavy for gold. US inflation remained persistent in August, increasing the probability that the Fed may keep a tighter policy stance at the September meeting. With the Fed rate decision coming on Wednesday, the market is not likely to move cleanly without confirm
XAU/USD: Market Analysis and Strategy for September 14Last Friday, following the release of US CPI data, gold bottomed out at $4,294 and staged a strong rebound, surging to $4,402 before pulling back; it gained over $100 to close at $4,327. Looking at the trend over the past two weeks, gold has been in a fluctuating downtrend on the daily chart since peaking at $4,696 on August 15, having now fallen nearly $400. Weekly and monthly charts suggest the bearish trend will persist, with a high probability of the price dropping below $4,000.
On the dail
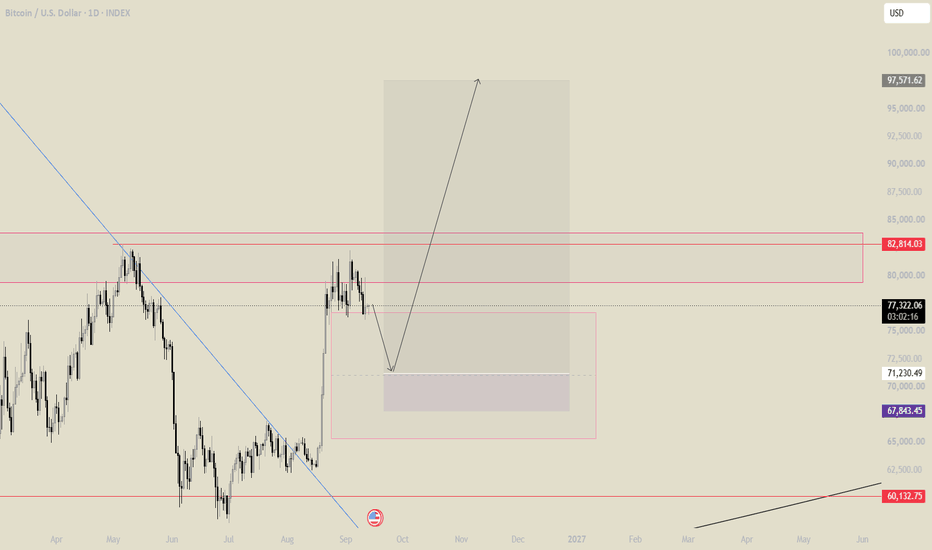
Bitcoin looking for longs Waiting for the CE of that weekly gap , and then there is daily low right below the daily gap too , so we might get the desired dip on wednesday during the fomc meeting , where rates are expected to go up for 75bps. I will enter a long position and try to bottom tick at that price range .
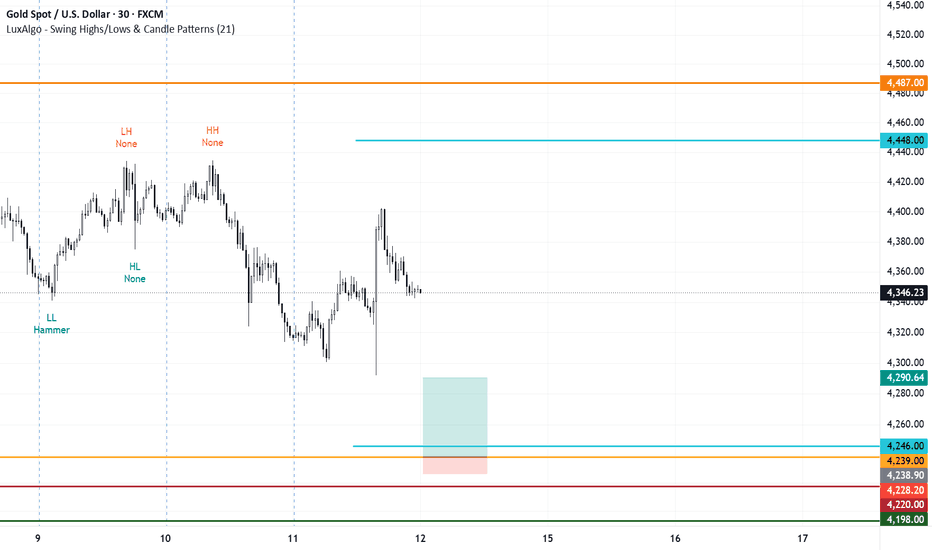
XAUUSD | Bullish Buy Zone | Long SetupXAUUSD is approaching a key demand zone where I’m looking for a potential long setup.
🔹 Buy Zone: 4240
🔹 Entry: After bullish confirmation
🔹 Stop Loss: Below the demand zone
🔹 Take Profit: 4290
The setup is based on price action and the reaction around this key demand area.
⚠️ This is my personal analysis and not financial advice. Always use proper risk management.
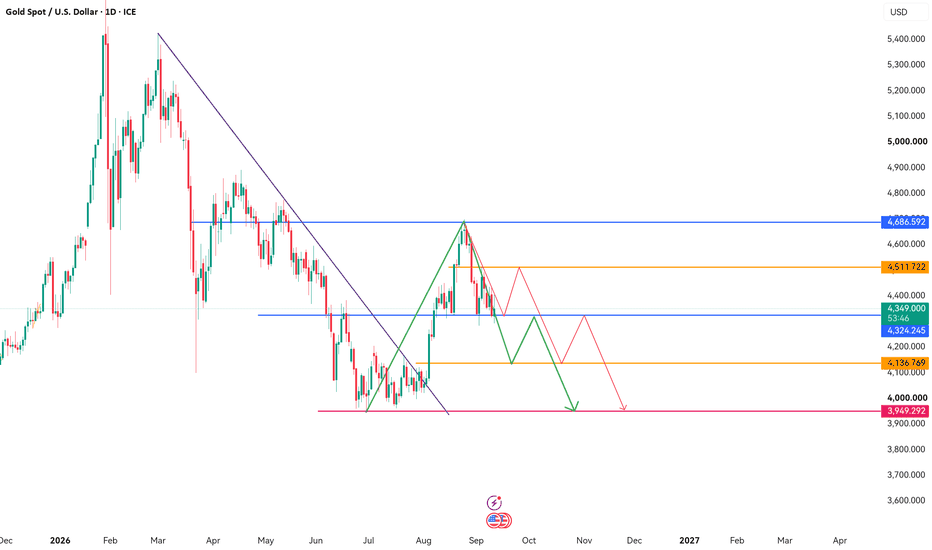
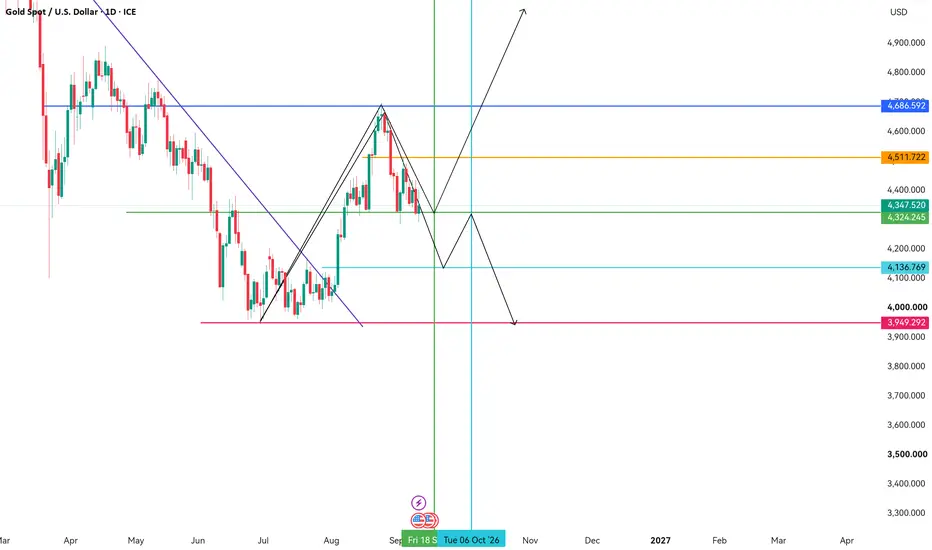
Gold Market Analysis UpdateIf the price manages to hold above 4,324 through the 18th, the current trend is likely to continue. Traders should remain cautious around the 18th, as this date could become a key turning point.
However, if the price fails to sustain the 4,324 level through the 18th, the next potential target could be 4,136. Pay close attention around the 6th, as a price reaction occurring around this date could potentially trigger a strong reversal.
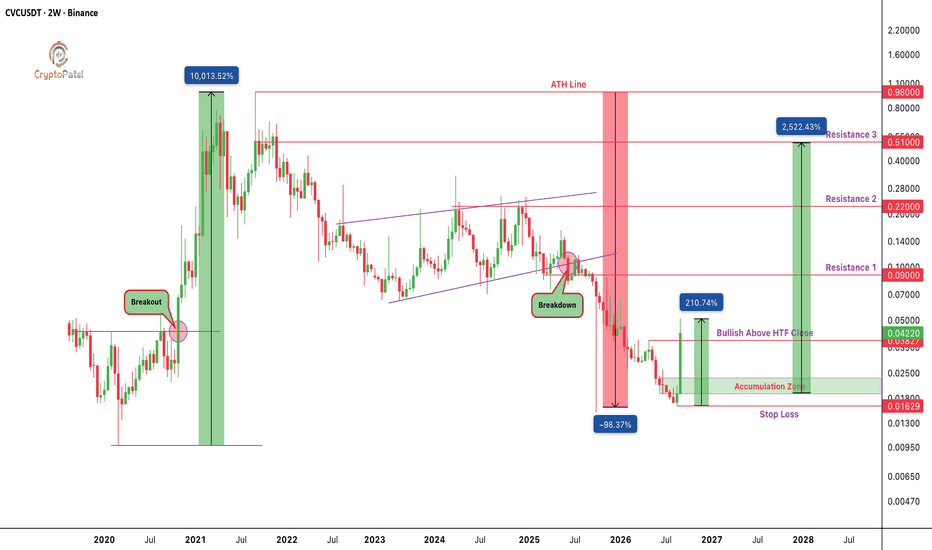
$CVC Up 210% in Just 4 Week So Still 10X Potential?EURONEXT:CVC DOWN NEAR 96% FROM ATH: IS THIS THE NEXT 2,000%+ CRYPTO REVERSAL SETUP?
#CVC Has Experienced A Multi-Year Bearish Cycle, With Prolonged Selling Pressure And Structural Weakness.
But After A Deep Correction, Price Is Now Showing Strong Recovery Momentum, Rising 210% In Just 4 Weeks. Is CVC Building Its Next Major Expansion?
TECHNICAL STRUCTURE
✅ Multi-Year Bearish Corrective Structure | 4-Week Rally: +210%
✅ Critical HTF Bullish Flip: $0.03827
✅ Potential Accumulation Zone: $0.024
XAUUSD H1 – Gold Is Consolidating, Waiting for a BreakoutOn the H1 timeframe, Gold is currently moving within a clear consolidation structure following the previous bearish move.
Main Scenario
Price is moving between an important support area and resistance area.
If the support continues to hold, Gold may continue consolidating before making a decisive move.
The bullish scenario will become more attractive if price breaks above the resistance zone and confirms the breakout.
In this case, the next move could extend toward the higher liquidity area
Ethereum looks more bullish than Bitcoin. Is Alt Season coming?Bitcoin is having trouble breaking above the same high that ETH broke a while ago.
What is specifically happening with the dominance?
Naturally, it is falling.
Does dominance still have room to continue falling? I think so because it ran out of upside directional energy. It seems to me that it is heading toward P5, which is 58%.
Once the lower parallel is broken to the downside (then it is tested to the upside and becomes resistance), it is clear that the trend has shifted to the downs
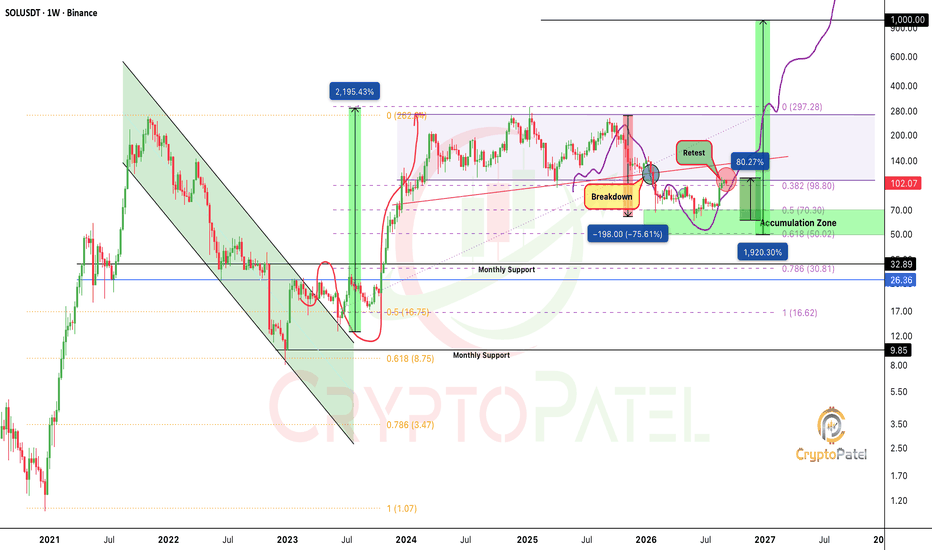
$SOL: THE NEXT BIG MOVE COULD DEFINE ITS LONG-TERM TRENDCRYPTOCAP:SOL : THE NEXT BIG MOVE COULD DEFINE ITS LONG-TERM TREND
Solana is approaching a critical HTF resistance zone near $110 and this is where patience becomes more valuable than prediction.
The chart presents two clear scenarios:
BULLISH BREAKOUT: A decisive weekly close above $110–$115, followed by a successful retest, could confirm renewed bullish momentum. If buyers reclaim control, the next major upside levels to monitor are $140, $200, and eventually a potential new all-time high.
Spiral event nearing 9/09 to 9/11 from Feb 19 th2025 top F14The chart posted is my work based on golden ratio Spirals from the Spiral Calendar . On sept 10 th . We have a cluster of spiral from 9/3 to 9/10 Each turn is from a past major high and low to calculate spirals Also on sept 10th we will have a NEW MOON . I am looking for an Event on 9/10 week. So I have now moved back to 100 % cash . It is my view that since we are at the 25th anniversary of 9/11 that the time window from 9/10 to11/3/2026 The world and world markets will be in a Neg
Analys based on gan angel and gan price levelThe price moves upward and reaches the 50% level of the Gann price range.
The price then follows the previous cycle. After reaching the 50% level, the price reverses downward and continues to complete the cycle.
This analysis is based on the observation of price reaction to Gann angle and Gann price levels.
Market DNA Oil Cycle 3 Phase 3 of 4
Will the next phase be Phase 4? We are navigating the market to see what happens next.
Phase: 1
Primary Entry M: 96.325$
Secondary Entry P(c): 89.653 $
Mean Entry: (96.325+89.653)/2=92.989$
Trapezoid Time Duration: 46 Days
3th Triangle domain (%): 2 * 8.5% = 17%
Risk coefficient:2
Risk domain (%): (3th Triangle domain) *(Risk coefficient) = 17%*2=34 %
Hypothetical Capital: 100,000$
Contract Size: 1000 Barrel
Expected Max Drawdown (%): 5%
Expected Max Drawdown $: 100,000 * 5% = 5,000
Expected
LAPTOP: $401B FDV to $352M in 48H | Liquidity Trap BreakdownLAPTOP: $401B FDV to $352M in 48 Hours | Liquidity Trap Breakdown
Chart setup:
KuCoin LAPTOP/USDT (it carries the most volume), 1H timeframe, Log scale on. Draw horizontal lines or boxes at $401.12 (ATH), $37.26 (open), a $3.70 to $4.47 zone, $1.00, a $0.69 to $0.80 supply box, and $0.3378 (ATL), with a label for each.
Short (bearish bias only; the description warns against shorting a thin book)
$LAPTOP just delivered one of the most extreme launch collapses in meme coin history.
$401B FDV o