Nifty IT (CNXIT) — Head & Shoulders Invalidation to Inv H&S Bull📈🔥
💻 Technical Analysis Breakdown:
Pattern Structure: Clean, multi-month bottoming structure forming on the Daily chart.
Breakout Zone: Resistance cluster at 31,842 – 32,131 marks the key neckline hurdle.
Consolidation Projection: A right shoulder dip/consolidation before a full macro expansion into late Q3/Q4.
🎯 Targets:
Linear Target: 38,586.65
Log Target: 40,197.95
#NiftyIT #TradingView #TechnicalAnalysis #IndianStockMarket #PriceAction #BreakoutSetup
Head and Shoulders
XRP/USD — 1H Market Structure Analysis🔎 Market Structure
XRP/USD has been in a broader bearish structure on the chart, with price declining from the 1.08–1.09 area toward the 1.01–1.02 region.
The recent recovery has created a short-term ascending trendline and pushed price back into the previously important 1.042–1.052 resistance zone.
This makes the current area a key decision zone, rather than an automatic reversal point.
🟥 Support → Resistance Zone
~1.042–1.052
This zone previously acted as support and was later broken. Pr
JIO FINANCIAL SERVICES (NSE: JIOFIN)Technical Confluence & Pattern Exhaustion
Textbook Downside Symmetry Completed:
Pattern 1 (2024): Head & Shoulders top near ₹394 broke the ₹310 neckline, cleanly hitting the projected linear target near ~₹226 (sweeping liquidity at the opening candle wick near ₹198).
Pattern 2 (2025–2026): Replica Head & Shoulders top near ₹340 broke the ₹290 neckline, hitting the linear target near ~₹240 with exact mathematical precision.
Full Liquidity Absorption & Double Bottom Base:
Downside targets from
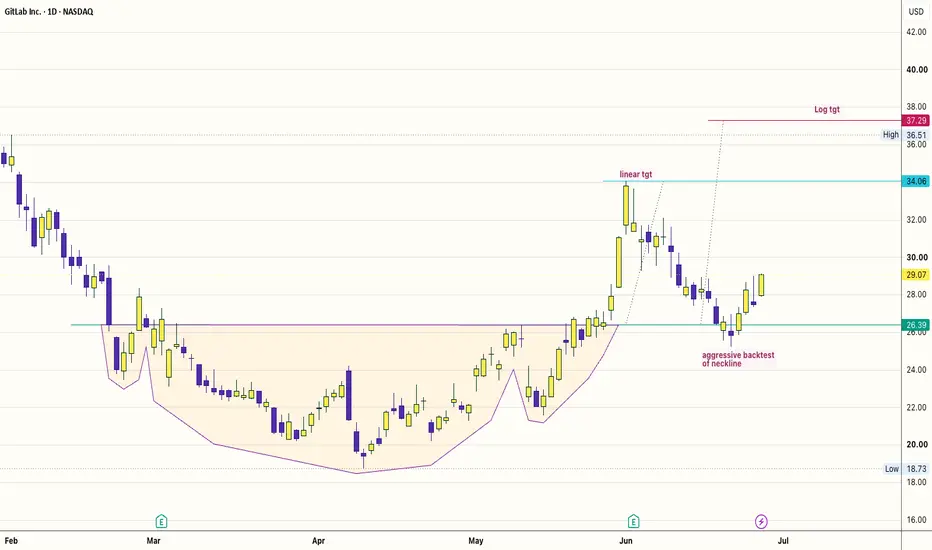
GTLB: Whales Buying the AI Fear — Textbook Neckline Backtest🦊 💻🦊 💻 📈 🚀 📈 🚀
When the broader market panics over sweeping, generalised macro narratives, the smart money quietly separates the structural winners from the noise.Software names got absolutely hammered in June on widespread "AI disruption" fears.
Morgan Stanley recently characterised this environment as a "peak uncertainty" moment for the entire enterprise software landscape.
But while retail investors threw the baby out with the bathwater, the institutional tape tells a completely different
LTC 1D Short & Long SetUp IDEA ! LTC 1D 👀
#LTC is close to forming a Head & Shoulders on the daily chart.
If confirmed I’m watching 32$ to 28$ as the target.
• Below 43.5$ - Short, SL 45.7$
• Above 46.5$ - Wait for 48$ to 51$ then short, SL 53.4$
For the spot buy or low leverage LONG trades, I’ll look to buy below 32$ and hold for the 80$ to 128$ range.
For now I’m just waiting for the setup. 👀
Continuation patternThis looks so bearish. Bearish flag forming in the weekly timeframe. Above it, we have a huge double top and HS, very strong bearish patterns. I opened a short position at current price. My SL triggers if a weekly candle CLOSES above 113. I don't see how this is coming back in the short term. I think eventually is going to drop to 50, but one step at the time.
MESU Aug 7: 7774 Upside or 7682 After 7724 Break?MESU is currently trading between two important higher-time-frame fair value gaps.
The upside imbalance around 7,774 remains open and continues to act as my primary upside liquidity target.
On the downside, the larger fair value gap around 7,682 remains in play.
The key intraday decision level is the overnight low around 7,724.
If buyers continue to defend 7,724, price may still have room to rotate higher toward 7,774.
However, a confirmed 1-hour close below 7,724 would increase the probabi
XAUUSD: Inverse Head & Shoulders Testing Key Neckline ResistanceHi!
Gold is displaying a potential bullish reversal structure, printing a clear Inverse Head and Shoulders (iH&S) pattern right off an established Support & Demand (S&D) zone.
Key Technical Dynamics
Base Formation at Strong S&D Zone: The entire structure has developed directly above a major support region ($4,005 – $4,020 area). The strong buyer presence at this level created the foundation for both shoulders and the head spike lower, signaling robust demand underlying current prices.
DG: Inverse Head & Shoulders Near BreakoutDollar General is testing the neckline of a developing inverse head-and-shoulders pattern near the 0.5 Fib retracement at $128.84.
Momentum is constructive, with RSI above its average, but daily stochastics are already overbought. Because of that, I would avoid chasing price before confirmation.
Entry plan
Primary entry:
Wait for a confirmed daily close above the full $128–129 neckline/Fib zone, ideally followed by a successful retest as support.
Fallback entry:
If price rejects the breakout
XAGUSD BUY 60.90On the daily chart, XAG/USD has stabilized at lower levels, with short-term price action forming a potential head-and-shoulders bottom pattern. Attention should be focused on support near 60.9; if the price pulls back and stabilizes there, further buying could be considered. Key resistance lies near 63.2, and a breakout above this level would open up room for further upside.
HD - Resistance Retest and H&S Setup💡 Swing setup idea
Resistance retest / breakout setup
🔎 Analysis summary:
The price crossed above the 50 SMA and has now come back to resistance. We can also see a head and shoulders pattern forming, with buyers starting to step in.
👀 Levels to watch:
Entry trigger: Break above $358.20
Target: $417.20
Stop: Under the breakout level
💬 Will the price break through this area? Let me know in the comments! 👇
Good luck!
⚠️ Note: This is for educational purposes only and is not financial
Technical short after earnings callNASDAQ:AMD actually crushed Q2 - revenue up 50% YoY to $11.54B, EPS beat, Data Center revenue more than doubled. Q3 guide was solid too. Despite the beat, the stock is down ~9% in after-hours trading, driven by a sharp jump in capex.
Technically, we should complete Head & Shoulders top in the next days. The break of the neckline on heavy volume will project a measured-move target near $267, using the head-to-neckline distance.
Levels to watch:
Neckline: $418–432
Downside target: $267
Ethereum Analysis: Head & Shoulders Breakdown in Progress?Ethereum appears to be forming a **Head & Shoulders** pattern, most clearly visible on the **1H to 4H timeframes**. This is the primary structure I'm watching, as it could signal a shift in momentum if the pattern continues to develop.
Using the **Fibonacci retracement tool**, I've noticed that price has consistently respected the **golden pocket** before beginning to break below the **38.2% retracement level**, suggesting that sellers may be gaining control.
Another area I'm watching is the *
Diamond Top, Trendline Test: QQQ's Make-or-Break MomentQQQ ran in a powerful, clean uptrend from the April low near 558 to a peak just above 745 in mid-July — essentially an uninterrupted V-recovery with barely a pause until price reached the low-700s. That's the move captured by the yellow trendline.
The diamond top: Once price hit the 700-745 zone, it stopped trending and rotated into a diamond formation — price action first widening (higher highs, lower lows) then compressing back to a point. Diamonds that form after an extended advance are clas
USAR: Head & Shoulders, Bounce Off Support, Possible Kumo BounceThis was another Soloway tip. He presented it as a day-trade or short swing-trade opportunity. He predicted a bounce off the support line. I rather expect, come Monday, that's what we'll see. I don't think he mentioned anything about the head and shoulders. But it's there.
If the bounce makes it up to the Kumo, you could see a second bounce--a Kumo bounce. Ideally, you'd like to see rejection of the Kumo in the form of an expansion candle, bearish engulfing, or pin. So, price could g
$UNH Head & Shoulders in the makingNYSE:UNH
An important observation on this short.
One day reversal
Earnings were a beat which created a huge spike that was completely reversed the same day. At the top (including our example of a local top), that usually indicates a change of trend. Needless to say, the volume here checks out.
I will be looking to sell short if the neckline breaks below with a set timer on that event. Ideally on good volume.
The borrow rate on UNH is extremely low at 0.40% so it only makes sense to s
BTC just completed a continuation Head & Shoulders patternCRYPTOCAP:BTC
Bitcoin price action has been incredible in the last few months. 3x continuation Head & Shoulders patterns completed (A, B, D) with B and D being shoulders of the inverted Head & Shoulders pattern C that is in the making. Let's see how far the D pattern drags down the price.
D Target: $58,350 (-7.00%)
C Target: approx $76,000 (14.00%)
AMC | Trifecta: Blockbuster Revenues, Layoffs and 5 Year CoilWhether your tracking theater chains like AMC capitalizing on a massive post-pandemic box office rebound, or major media empires like Disney and Paramount getting lean, this general-purpose, high-energy information is built for you.
Every now and then, the market creates a structure so beautifully wound up that ignoring it becomes a financial hazard. We are looking at a classic turnaround story backed by brutal corporate efficiency, explosive consumer demand, and a multi-year technical pattern
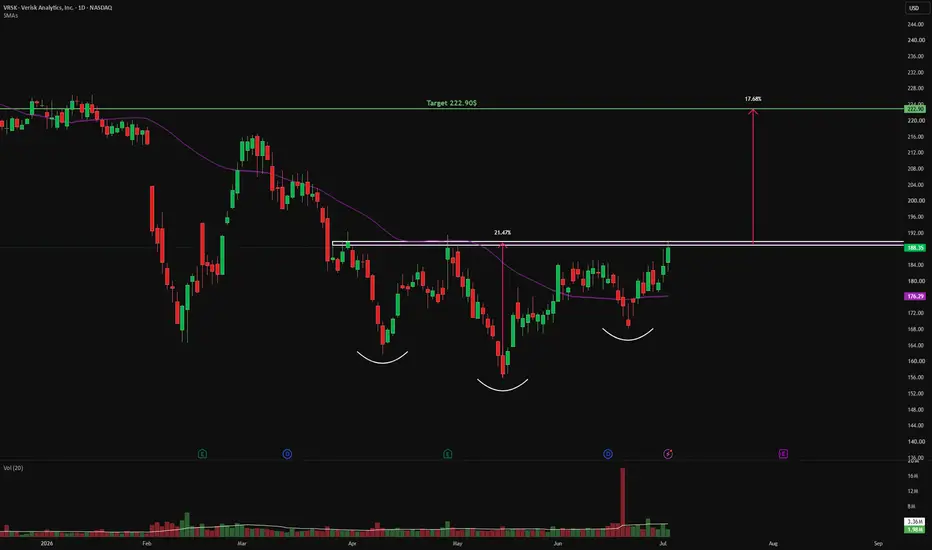
$VRSK - Reverse Head and Shoulders Pattern💡 Swing setup idea
50 SMA breakout
🔎 Analysis summary:
The stock broke above the 50 SMA and is currently closing a reverse head and shoulders pattern.
👀 Levels to watch:
Entry trigger: Break above $189.85
Target: $222.90
Stop: Under the breakout level
💬 What do you think of this setup? Let me know in the comments! 👇
Good luck!
⚠️ Note: This is for educational purposes only and is not financial advice.
MU: Head & Shoulder Neckline Breakdown Failed!MU showed Head and Shoulder Pattern with a breakdown from neckline.
However, neckline could not be sustained and the price has moved above the support line (neckline) confirming a fake breakdown.
Interestingly, MA 100 has shown significant support for MU historically and has taken support from 100MA recently.
Trade plans are provided along with SL and TP levels.
Mange your risk properly while trailing your SL.
Enjoy the ride!