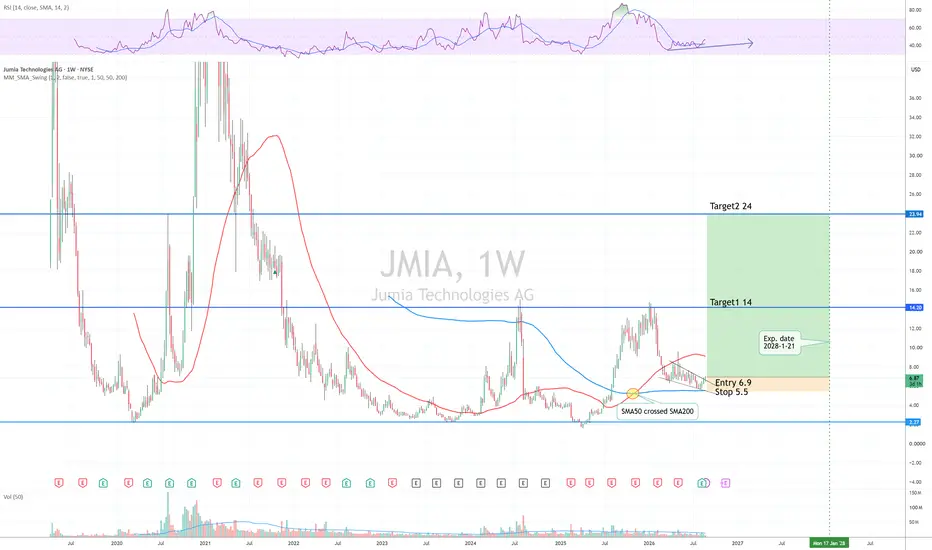
Long
Long
 Long
Long
SNOW has the cleanest trend heading into earningsGot this one by request, and it's a name I've been watching since I own it in my long-term portfolio but haven't actually dug into.
Snowflake is a cloud data/software play: over 95% of their revenue comes from their cloud-based data platform. It's been on fire since earnings in May and is one of the reasons that cloud is now nine weeks leading (more on this later).
Since earnings in late May, SNOW has been riding the 21ema (white line) and hasn't closed out a single session below it. That's the mark of a strong, extended trend and it gives something to watch for a change of character too. If the rally is marked by riding the 21ema, then breaking down below it and/or closing a session beneath that is a very clear sign that things have changed. And if or when that happens, the odds rise of a move down to the 50-day (yellow line).
On the technicals: SNOW has been consolidating since mid August, as marked by the blue line of lower highs in the chart. I also marked the other times that it's formed a similar pattern in this rally. With that, you can see that it's a repeating pattern of trend-consolidate-breakout-trend. So the thesis is that another breakout there results in a leg higher.
On the weekly chart, the stochastics are showing overbought. That's not a sell signal and overbought can persist for weeks or months. It's recently turned down too as price has, which could allow space for re-expansion. Weekly MACD doesn't help much because it just reflects the price momentum, which is very obviously up/bullish.
So back to cloud generally. I mentioned that my dashboard has logged it 9 consecutive weeks of leading the benchmark and that's some serious extension. I often see 10 weeks as being a mature theme that begins to taper off and/or reset. And what I'm seeing now is that it's a mature theme that is now decelerating. My dashboard says "Trim/hold, do not add". I don't always agree with it there, but it's very obviously slowing down.
The most important thing is that SNOW will report earnings soon, and that will dictate what happens next. I calculate implied volatility using ATM options for next week at around 14%, so SNOW should move. There are a couple of entries I see here. 1) The SNOW trend at 21ema is "right" until proven wrong, so one option could be to buy right around 21ema. I have no opinion on how their earnings will come out and be received. This is a riskier option since a gap down at earnings of 14% would be painful. 2) If SNOW gives a chance to buy the breakout from the blue line, that's another option, but an earnings gap higher takes this away. 3) A hybrid option could be something like getting exposure now and adding later. 4) This is my favorite play here : Let earnings pass. If SNOW breaks out hard and gaps up, great. I will wait for it come back down and tag either the 10-day or 21ema and get in.
SNOW is high beta, and high beta into earnings is a risk (just look at DDOG). To me, this is less clear than the recent earnings play I made in SE (linked below).
Bulls remain in control as long as $78K holdsHi traders! 🌴🧠
In my last post, I mentioned: “If BTC can continue holding the $76-78K area and keep moving higher without the fuel of massive liquidations, that would be a much healthier signal for a continuation towards the next major horizontal level at $82.5K+.”
Today, Bitcoin broke above $80,000 amid strong inflows into ETFs. Over the last six trading sessions, U.S. spot crypto ETFs attracted around $2.26 billion in capital 💰💰💰
So now, the rally is being supported not only by short covering and liquidations, which I wrote about earlier, but also by fresh institutional demand.
What does the chart look like now? 🧐
The initiative remains on the bulls’ side, and at the moment we are seeing an attempt to consolidate within the $76-80K range.
The reaction to the middle of this range at $78K is significant — bulls continue to buy every approach to this level. So far, they are also keeping price away from the lower boundary of the range at $76K.
I’ll continue watching the battle inside this range.
🦬🚀Holding $78K followed by a breakout above $80K would almost certainly send price towards a break of the local high and then towards $82.5K.
🐻🪓Failure to hold $78K, on the other hand, would weaken the bulls’ position and could quickly send price towards the lower boundary of the range at $76K.
A break below $76K would open the door for the bears to develop a correction towards $73.7K.
Peace! 🌄
⚠️ Disclaimer:
All information shared on this channel is for educational and informational purposes only and is not investment advice. The author is not responsible for your trading decisions. Always manage your risks and make decisions independently.  Long
Long
 Long
Long
 Long
Long
 Long
Long
 Long
Long
7705 didn’t hold. Can the bulls defend the previous ATH at 7625?Hi traders! ☀️🌴
In my last post, I tried to build my outlook around the breakout or defense of the 7705 level:
“🦬🚀As long as price holds above 7705, I expect the uptrend to resume toward the nearest resistance at 7777 and then potentially toward the ATH.
🐻🪓If 7705 breaks, we could see an acceleration lower toward the previous ATH at 7625. This move could be very sharp and could be triggered by any negative news, so please be extremely careful with your risk management.”
Unfortunately for the bulls🦬⚰️, the 7705 level didn’t hold, and after the breakdown we did indeed move toward 7625, with price currently showing a local low at 7641.
The positive part is that the move was not very sharp, and 7625 remains untouched so far. On top of that, this level is now reinforced by the 4H EMA 200, which could make things difficult for the bears if they attempt to break below it.
What’s next?
🦬🚀Bullish scenario.
Bulls defend 7625, followed by a breakout above the local trendline. In this case, price could accelerate toward 7705, and a breakout of that level could then open the way toward 7777.
🐻🪓 Bearish scenario.
Bears manage to push through 7625. In this case, we could see a drop toward 7555. And this is where the bears will really have to work, because 7555 is a concrete wall — price has repeatedly slowed down around this level when approaching it from below.
Peace! 🌄
⚠️ Disclaimer:
All information shared on this channel is for educational and informational purposes only and is not investment advice. The author is not responsible for your trading decisions. Always manage your risks and make decisions independently. USD/CAD Rises as Canada Trade Shock Hits the LoonieUSD/CAD rose half of one percent on Monday as the Canadian Dollar came under pressure after U.S.-Canada trade negotiations broke down. Markets reacted to the renewed tariff fight, with the U.S. imposing 50% tariffs on a range of Canadian goods and Canada preparing a dollar-for-dollar response. That hit the Canadian Dollar directly because it raises growth risk, threatens export demand, and adds a fresh political premium to Canadian assets. Even though the broader U.S. Dollar was not especially clean today, it outperformed the Canadian Dollar as trade risk became the dominant driver.
Oil made the move worse. Crude prices fell around 2% as markets waited for new U.S. sanctions on Iran, stripping away the usual commodity support Canada gets when energy markets are firm. For the BOC, this is a bad mix: tariffs threaten growth, oil weakness hurts the terms-of-trade story, and inflation risk is still complicated by trade policy. The central bank has room to stay patient, but the Canadian Dollar does not get much support from a patient BOC when the U.S. side still has firmer rate expectations and Canada is absorbing a direct trade shock.
USD/CAD is bouncing, but the chart has not repaired yet. The pair flushed hard from the late-June high above 1.4200, broke below the moving-average stack, and sliced through the prior support zone around 1.3920-1.3970. That zone is now the key resistance band. Today’s move back toward 1.3825 is a relief rally from oversold conditions, not a confirmed trend reversal.
The short-term damage is still visible. The 1-week and 1-month EMAs (exponential moving averages) are sloping lower, price is below the 50-day EMA, and the 1.3920-1.3970 shelf sits directly overhead. MACD remains negative, which says downside momentum has not fully unwound. Slow Stochastics are the one near-term bullish input: they are turning up from oversold territory, so the Canadian Dollar short squeeze has paused and the U.S. Dollar can bounce for a few sessions. But until USD/CAD reclaims the broken support zone, the move looks corrective. WTI - Inverse Head and Shoulders to 100Crude oil could be basing out in the form of an inverse head and shoulders.
And previous times at critical areas, whenever the Stoch RSI (4H) is oversold or overbought, there tends to be a reversal.
We're now forming a 4H oversold reaction at a broken multi-month trendline.
That, plus, we're retesting the green band (4h-50 EMA, 1 standard deviation), which currently signals a local uptrend and should act as support.
If price breaks the 87.84 neckline and holds above 85.95, oil is technically positioned for upside.
If price does not follow through and is accepted back below the trendline, then I would consider this a failed breakout.
Please keep in mind that: Oil is extremely sensitive to geopolitical developments in Hormuz, talks with Iran, tariffs, or even sanctions.
So this idea should be viewed as more of price confirmation of whichever catalyst ultimately breaks oil in either direction.
- Yang  Long
Long
Intel Might Be Sputtering After Big RunIntel has enjoyed a big surge in the last year, but now some traders may think it’s sputtering.
The first pattern on today’s chart is the July 22 high of $106.85. The chipmaker stalled at that level on August 13, which may suggest resistance has formed below its recent peak.
Second, the weakness occurs as the 50-day simple moving average turns lower. That may indicate that the intermediate-term trend has turned bearish.
Third, the 8-day exponential moving average (EMA) is under the 21-day EMA. MACD is also falling. That may reflect short-term bearishness.
Next, the stock gapped higher on April 24. Could traders look for a test of that price zone?
Finally, INTC is an active underlier in the options market. (Its average daily volume of 844,000 contracts ranks sixth in the S&P 500.) That could help traders take positions with calls and puts.
TradeStation has, for decades, advanced the trading industry, providing access to stocks, options and futures. If you're born to trade, we could be for you. Learn more here about TradingView’s Broker of the Year!
Past performance, whether actual or indicated by historical tests of strategies, is no guarantee of future performance or success. There is a possibility that you may sustain a loss equal to or greater than your entire investment regardless of which asset class you trade (equities, options or futures); therefore, you should not invest or risk money that you cannot afford to lose. Online trading is not suitable for all investors. View the document titled Characteristics and Risks of Standardized Options at www.TradeStation.com . Before trading any asset class, customers must read the relevant risk disclosure statements on www.TradeStation.com . System access and trade placement and execution may be delayed or fail due to market volatility and volume, quote delays, system and software errors, Internet traffic, outages and other factors.
Securities and futures trading is offered to self-directed customers by TradeStation Securities, Inc., a broker-dealer registered with the Securities and Exchange Commission and a futures commission merchant licensed with the Commodity Futures Trading Commission). TradeStation Securities is a member of the Financial Industry Regulatory Authority, the National Futures Association, and a number of exchanges.
Options trading is not suitable for all investors. Your TradeStation Securities’ account application to trade options will be considered and approved or disapproved based on all relevant factors, including your trading experience. See www.TradeStation.com . Visit www.TradeStation.com for full details on the costs and fees associated with options.
Margin trading involves risks, and it is important that you fully understand those risks before trading on margin. The Margin Disclosure Statement outlines many of those risks, including that you can lose more funds than you deposit in your margin account; your brokerage firm can force the sale of securities in your account; your brokerage firm can sell your securities without contacting you; and you are not entitled to an extension of time on a margin call. Review the Margin Disclosure Statement at www.TradeStation.com .
TradeStation Securities, Inc. and TradeStation Technologies, Inc. are each wholly owned subsidiaries of TradeStation Group, Inc., both operating, and providing products and services, under the TradeStation brand and trademark. When applying for, or purchasing, accounts, subscriptions, products and services, it is important that you know which company you will be dealing with. Visit www.TradeStation.com for further important information explaining what this means.  Long
Long
 Long
Long
 Long
Long
 Long
Long
 Long
Long
 Long
Long
 Long
Long
 Long
Long
 Long
Long
Long 
 Long
Long