LTCUSDT | Bullish run continues? (READ THE CAPTION)In the 2H chart of LTCUSDT, we can see that Litecoin has been on a bullish run in the past couple of days, going from 76.08 all the way to 82.82, and after hitting the FVG, it has dropped in price to 81.50 and is being traded there.
If it drops further, I expect a reaction to the Bullish Breaker. Otherwise, I expect it to challenge the FVG yet again.
Bearish Targets: 81, 80.60, 80.20 and 79.80.
Bullish Targets: 82, 82.40, 82.80 and 83.20.
Rising Wedge
Movement comparisonBitcoin and Monero have approximately the same amount of coins in circulation. Bitcoin has an average of 500,000 transactions daily, while Monero has around 20,000. The Monero ownership centralization is obvious, but not provable.
The two assets have significantly opposite price movement.
The LTCBTC/XMRBTC pair is at the channel top.
The XMRUSD/LTCUSD is retesting long-term support.
The channel has been violated, which possibly means a strong corrective wave in the opposite direction is comin
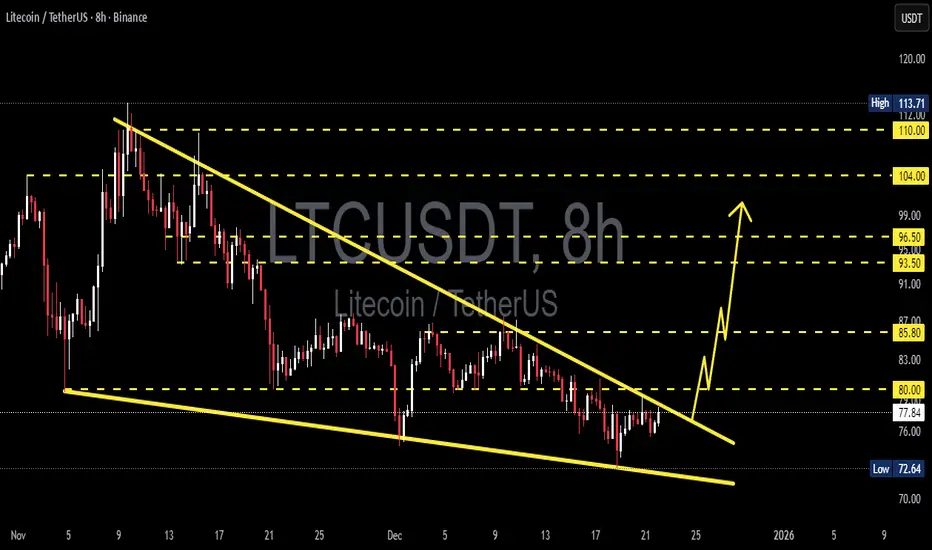
LTC/USDT — Falling Wedge Formation Signals Potential ReversalOn the 8-hour timeframe, Litecoin (LTC) remains in an overall downtrend. However, the price structure is not moving in parallel lines, indicating that this is not a descending channel. The upper resistance trendline is steeper than the lower support trendline, signaling weakening bearish momentum.
Price is currently trading near the final phase of the pattern, approaching the apex, where a strong directional move (breakout or breakdown) is likely to occur.
---
Pattern & Price Structure
Patt
LTC/USDT — Market StructureThe resistance block and the channel midline proved too strong — after another test, price moved into a correction.
The $70–95 range is the most heavily traded zone, where position building is taking place.
A bullish wedge is currently forming within this range.
Trade options:
— accumulate inside the pattern with a mandatory stop-loss below it;
— or wait for a confirmed breakout above the wedge’s upper boundary and enter on confirmation.
🎯 Primary targets: $93 and $110.
Long-term targets sh
LTC: Breakout Before Altcoin SeasonPrice has been moving inside a large 3‑month symmetrical triangle, with lower highs from the 2017 peak and higher lows since the 2018 bottom.
The current candle is compressing between the support and resistance trendlines, suggesting a larger move is getting closer.
A confirmed breakout above the triangle resistance and the 0.5–0.618 Fib would open the way toward the marked profit zone in the 0.65–0.786 area (~185–255 USD), where previous supply sits.
As long as the higher‑low structure hold
LTCUSD H4 | Bearish ContinuationMomentum: Bearish
Price may retrace to the sell entry, which aligns with the 38.2% Fibonacci retracement, adding significant strength to this level.
Sell Entry: 79.61
Pullback resistance
38.2% Fibonacci retracement
Stop Loss: 86.49
Pullback resistance
Take Profit: 71.03
Pullback support
High Risk Investment Warning
Stratos Markets Limited (tradu.com ), Stratos Europe Ltd (tradu.com ):
CFDs are complex instruments and come with a high risk of losing money rapidly due to leverage. 70% of ret
LShort
LTCUSDT (4H) chart update !!Litecoin is holding a strong demand zone around 76–80 and moving sideways under a long-term descending trendline.
A confirmed breakout above the trendline (~84) could trigger a bullish move toward 92, then 100, and ultimately 120.
If the price falls below the 76 support, the downside risk remains toward 69.
Bias: Neutral → Bullish on breakout.
DYOR | NFA.
Why This 2022 Bitcoin Fractal Might Fail The 2022 bear‑market fractal 📉
The fractal taken from the 2022 bear market. Back then Bitcoin built a rising wedge pattern and then dropped about 60% in value from the breakdown.
What “everyone” expects now 😱
Many traders now expect Bitcoin to repeat that same pattern crash.
Social media, bears and even cautious bulls keep pointing to the old wedge and saying “this dump is next.”
Why this time can be different 💡
Markets rarely give the majority the easy trade; when everyone leans to one
LTC is going up or down ? Answer is be patience I still consider the LTC a Buy, for a potential of good returns and growth by 2027. At present it looks like many manipulators raising the fear index and making price fail under low volatility conditions. If we have to not fall in trap the only way is to stay patience even it shows a sharp fall to 65. Don’t make panic selling and account losses on your ledger. Let the market stable. Consider your 2x to 4x returns only by 2027 and stay quiet for now.
Just my opinion, be cautious on your investme
#LTC/USDT analysis.Give me some energy !!!#LTC
The price is moving in a descending channel on the 1-hour timeframe. It has reached the lower boundary and is heading towards breaking above it, with a retest of the upper boundary expected.
We have a downtrend on the RSI indicator, which has reached near the lower boundary, and an upward rebound is expected.
There is a key support zone in green at 82.00. The price has bounced from this level multiple times and is expected to bounce again.
We have a trend towards stability above the 100
LITECOIN can easily hit $43 in the next 10 months.Litecoin (LTCUSD) started its new Bear Cycle after a rejection on the 4-year Lower Highs trend-line. Now that it sits below its 1W MA200 (orange trend-line), which was formally a Resistance during the Bull Cycle, we can claim that the next stage should be targeting the Higher Lows 1 trend-line.
Given that all previous Bear Cycles lasted for at least a year and that the last one dropped less than the 2018, we can expect LTC's new Bear Cycle to last up until August 2026 at least. Even a 'modest'
Price-Action Analysis (Gold – Daily Chart)Price-Action Analysis (Gold – Daily Chart)
1. Rising Wedge Structure
The chart highlights a rising wedge, where price is moving higher but the slope of the highs and lows is converging.
This shows that although price is advancing, the momentum is slowing because each new high is made with decreasing strength.
The wedge boundaries show price repeatedly touching both the upper and lower trendlines.
2. Recent Price Behavior
Price moved from the lower wedge boundary upward and recently touched
FireHoseReel | LTC:When does Litecoin explode next?🔥 Welcome to FireHoseReel!
Let’s dive into the 4H Litecoin (LTC) analysis.
👀 Litecoin is currently trading below a descending curve trendline.
Each time price hits this curve, it gets rejected to the downside. Price is now approaching the end of this compression zone, while a key support has formed at $81.48 near the bottom.
📊 Litecoin volume has been declining during the recent drop and is now at very low levels.
Once volume expands again, any upcoming move in LTC is likely to become more imp
Litecoin LTC/USD Buy The Fear Sell The EuphoriaI haven't made a Litecoin chart in a while. We've been sideways and uneventful, figured I would wait till something eventful happens. Well here it is folks , the moment before we actually move up everyone is selling except for a few smart hands. This fractal says it all in my opinion. fractals are usually very similar but not exact. Where we are now in price for Litecoin around 83 is really close to the bottom of this pullback. It washed out and cleaned up all the leverage, a very common o
Litecoin: Target Zone Within ReachLTC has recently continued its decline, leading us to believe that the high for green wave B is likely already in place. Price is now just a short distance from our green Target Zone, which ranges from $78.52 to $64.53. Within this zone, we expect to see the low of orange wave ii. Afterward, orange wave iii should drive price above the resistance levels at $118.71 and $147.06.
Rising Wedge Breakout Spells Decline Continuation For GUFX:GBPUSD delivered a Breakout of A Rising Wedge to end the week last week!
Next, we should suspect a Retest of this Breakout @ the 38.2% Retracement level around 1.31864.
This level proved to hold price below it through the formation of the pattern and would serve as a great area of opportunity to short the pair and ride Price down!
If the Retest of the Breakout is successful, Price would next find Support at the April Lows around the 1.28 - 1.27 area!
Fundamentally its a heavy week for U
Bitcoin Bear Market 2026 | Macro Cycle & Rising Wedge BreakdownBitcoin Macro Cycle Analysis (2013–2029) | Rising Wedge Breakdown • 2026 Bear Market Targets • Historical % Drops & Next Accumulation Zone
Bitcoin historical data strongly follows multi-year macro cycles , where each bull market has been followed by a deep bear market correction:
📉 2nd Cycle (2017–2018)
Top: 19,666 (17 Dec 2017)
Bottom: 3,122 (15 Dec 2018)
Correction: –84.23%
📉 3rd Cycle (2021–2022)
Top: 68,997 (8 Nov 2021)
Bottom: 15,479 (9 Nov 2022)
LTC Litecoin Poised For Something Big Macro Style I still see lots of people selling and capitulating. Thats ok that cant be prevented, most have no idea how markets work and those same people are afraid of their own shadow. The capitulation is almost over. I just want to point out the confluence of various indicators on the macro long term time frame pointing to a massive bull run for Litecoin. This is not financial advice just my opinion. Like and follow for more updates.
LITECOIN Analysis (4H)It appears that a double correction is forming on Litecoin and is nearing completion. Around the origin zone, we can look for long buy positions so that once this second corrective leg finishes, the price can enter a bullish phase.
The entry zone and targets are marked on the chart.
For risk management, please don't forget stop loss and capital management
When we reach the first target, save some profit and then change the stop to entry
Comment if you have any questions
Thank You
LTCUSD H4 | Could We See A Bullish Reversal?Momentum: Bullish
The price has recently bounced off the identified buy-entry level, which aligns with the pullback support zone.
Buy Entry: 889.05
Pullback support
Stop Loss: 79.91
Swing-low support
Take Profit: 102.38
Pullback resistance
Positioned slightly below the 61.8% Fibonacci retracement
High Risk Investment Warning
Stratos Markets Limited (tradu.com ), Stratos Europe Ltd (tradu.com ):
CFDs are complex instruments and come with a high risk of losing money rapidly due to leverage.
LLong
LTCUSDT : Full analysisHello friends
well you see that the power is in the hands of the sellers and we must have sufficient approvals to buy.
So you see, we have two important support areas that we have identified for you with Fibonacci, and they can be good supports. We need to see how buyers react in these areas.
Well, the next point is that despite the sharp drop in Bitcoin, Litecoin did not fall much. It fell by almost half of Bitcoin. Considering the previous times I saw that when Bitcoin fell, other currenci
LTC: Don’t FOMO, Wait for Confirmation$LTC/USDT is getting squeezed between the rising trendline and the overhead resistance zone. Price has tested this resistance multiple times before but failed to break through.
A potential upside move could develop if we finally see a clean close above the marked zone.
Until then, it’s best to stay patient, don’t FOMO, wait for a clear breakout pattern.
DYOR, NFA