Gold is Nearing an Important Resistance Line!Hey Traders, in today's trading session we are monitoring XAUUSD for a selling opportunity around 4300 zone, Gold is trading in a downtrend and currently is in a correction phase in which it is approaching the trend at 4300 support and resistance area. We would also like to consider the current bullish bias on the dollar that could put extra pressure on the metal.
Trade safe, Joe.
Technical Analysis
XAU/USD Update | Recovery Fails, Bears Stay in ControlPrice could not sustain the bullish move above 4193 yesterday, and we saw sellers regain control. The sell-off continued through the Asian session, with price now testing the immediate support zone between 4120 and 4068.
A strong bullish reaction from 4093 and reclaim of 4129 could see gold recover back towards 4193 and potentially 4258. The MA50 is currently sitting above price and may provide some dynamic resistance during any recovery attempt.
However, if support fails to hold, the next downside target becomes the secondary support zone between 4014 and 3938.
📌Key levels to watch:
Resistance:
4129
4193
4258
Support:
4093
4068
4014
3938
👉Stay patient, let the levels guide you, and wait for confirmation before taking a position.
MarketBreakdown | USDJPY, EURGBP, NZDUSD, EURNZD
Here are the updates & outlook for multiple instruments in my watch list.
1️⃣ #USDJPY weekly time frame 🇺🇸🇯🇵
The price is testing a resistance based on the current all-time high.
A strong intraday price action indicates a highly probable breakout.
A weekly candle close above the underlined area will provide a strong bullish signal.
The price will continue rising to the new highs then.
2️⃣ #EURGBP daily time frame 🇪🇺 🇬🇧
I see a huge bearish fair value gap.
It was caused by the resignation of a British Prime Minister yesterday.
I think that this FVG will be at least partially recovered.
3️⃣ #NZDUSD daily time frame 🇳🇿🇺🇸
The market dropped yesterday as I predicted.
The price is currently testing a significant historic support.
Its breakout will provide another strong signal to sell.
4️⃣ #EURNZD daily time frame 🇪🇺🇳🇿
The price went up strongly yesterday as I said.
The market is now testing another strong resistance.
I will be waiting for a daily candle close above that as another signal to buy.
Do you agree with my market breakdown?
❤️Please, support my work with like, thank you!❤️
I am part of Trade Nation's Influencer program and receive a monthly fee for using their TradingView charts in my analysis.
EUR/USD SHORT FROM RESISTANCE
Hello, Friends!
We are targeting the 1.142 level area with our short trade on EUR/USD which is based on the fact that the pair is overbought on the BB band scale and is also approaching a resistance line above thus going us a good entry option.
Disclosure: I am part of Trade Nation's Influencer program and receive a monthly fee for using their TradingView charts in my analysis.
✅LIKE AND COMMENT MY IDEAS✅
GOLD SELLERS WILL DOMINATE THE MARKET|SHORT
GOLD SIGNAL
Trade Direction: short
Entry Level: 4,209.20
Target Level: 4,122.20
Stop Loss: 4,266.82
RISK PROFILE
Risk level: medium
Suggested risk: 1%
Timeframe: 1h
Disclosure: I am part of Trade Nation's Influencer program and receive a monthly fee for using their TradingView charts in my analysis.
✅LIKE AND COMMENT MY IDEAS✅
EUR/AUD BULLS ARE GAINING STRENGTH|LONG
Hello, Friends!
EUR/AUD pair is in the downtrend because previous week’s candle is red, while the price is clearly falling on the 4H timeframe. And after the retest of the support line below I believe we will see a move up towards the target above at 1.643 because the pair oversold due to its proximity to the lower BB band and a bullish correction is likely.
Disclosure: I am part of Trade Nation's Influencer program and receive a monthly fee for using their TradingView charts in my analysis.
✅LIKE AND COMMENT MY IDEAS✅
GBP/CHF BEARS WILL DOMINATE THE MARKET|SHORT
Hello, Friends!
GBP-CHF uptrend evident from the last 1W green candle makes short trades more risky, but the current set-up targeting 1.065 area still presents a good opportunity for us to sell the pair because the resistance line is nearby and the BB upper band is close which indicates the overbought state of the GBP/CHF pair.
Disclosure: I am part of Trade Nation's Influencer program and receive a monthly fee for using their TradingView charts in my analysis.
✅LIKE AND COMMENT MY IDEAS✅
EUR/CHF SENDS CLEAR BULLISH SIGNALS|LONG
EUR/CHF SIGNAL
Trade Direction: long
Entry Level: 0.923
Target Level: 0.925
Stop Loss: 0.922
RISK PROFILE
Risk level: medium
Suggested risk: 1%
Timeframe: 1h
Disclosure: I am part of Trade Nation's Influencer program and receive a monthly fee for using their TradingView charts in my analysis.
✅LIKE AND COMMENT MY IDEAS✅
Ethereum Long-Term Outlook: Potential Correction Toward $1,000–$Ethereum remains under pressure as global macroeconomic conditions continue to challenge risk assets, including cryptocurrencies.
Several factors may continue to weigh on the market:
• Persistent restrictive monetary policies by major central banks
• Delayed interest rate cuts and the possibility of higher rates for longer
• Ongoing inflationary pressures in the United States and Europe
• Rising geopolitical uncertainty and global market instability
From a technical and liquidity perspective, Ethereum may still be in a broader corrective phase.
Key scenarios:
🔴 Scenario 1:
A significant market reaction could occur around the $1,000 liquidity zone.
🟢 Scenario 2 (Higher Probability):
A deeper correction toward the $700 area.
The $700 region stands out as a major long-term support zone due to the combination of liquidity concentration, historical market structure, and macroeconomic conditions.
In addition, the RSI is showing signs of a potential bullish divergence, suggesting that a long-term bottoming process could develop as price approaches these key demand areas.
It is important to note that these levels are not predictions of certainty but rather potential zones where a major market bottom may form.
Unless there is a meaningful shift in monetary policy or a significant improvement in global economic conditions, the broader outlook for Ethereum remains cautious and bearish into late 2026.
This analysis represents a long-term scenario and should not be considered financial advice.
If you found this analysis useful, feel free to support it with a like and share your thoughts in the comments.
#ETH #ETHUSD #ETHUSDT #Ethereum #Crypto #Cryptocurrency #TechnicalAnalysis #RSI #Liquidity #MacroEconomics #FederalReserve #InterestRates #TradingView
Coinbase Breaks Below Support as Bearish Wave 5 Gains TractionCoinbase has staged a notable recovery from the 141 low, but the structure of the advance suggests caution is still warranted. The move higher appears to be unfolding in three waves, which is typically characteristic of a corrective rally rather than the start of a new bullish trend.
This interpretation is supported by the preceding decline from the 400 area, which was strong, impulsive, and extended—traits commonly associated with a third-wave decline in Elliott Wave theory. As such, the current recovery may represent a wave four correction within a larger bearish sequence rather than a lasting trend reversal.
The stock has also been testing an important resistance zone between 210 and 250. While price remains within this area, the risk of another bearish turn remains elevated. More recently, Coinbase has broken below the lower trendline support near the 180 level, increasing the probability that wave five lower is now underway.
From a bullish perspective, it is still too early to declare the downtrend complete. A break above 291 would be needed to invalidate the current bearish wave count, as wave four should not overlap with wave one territory. Such a move would signal that the broader bearish trend is likely over and would shift the focus toward buying opportunities on future pullbacks.
Highlights:
Current rally appears corrective and is unfolding in three waves.
Key resistance zone between 210 and 250 remains important.
Break below 180 signals increased risk of bearish continuation.
A move above 291 would provide stronger bullish confirmation.
XAUUSD: Final Elliott Wave 5 Is Still in PlayGold is currently moving inside what appears to be the final Elliott wave 5 structure after the recent rejection from the liquidity imbalance zone. From Kelly’s view, the market is still showing downside pressure, but this may be the last bearish leg before a larger corrective recovery begins.
The key point is simple: wave 5 remains valid while price stays below the highest resistance formed at today’s open.
⟡ Market structure
The chart shows gold rejecting from the upper imbalance area and then moving lower through a clear bearish sequence. Price is now trading around 4,195, inside a short-term corrective channel, while the market continues to respect the descending trendline pressure.
The 4,220 area is acting as the nearest resistance and also the zone where wave 5 begins on the chart. If sellers keep defending this area, gold may continue lower towards the Elliott wave end zone near 4,020–4,040.
However, if price breaks above the highest resistance from today’s open, the wave 5 bearish setup would lose quality and the market may need a new interpretation.
➤ Key levels
◌ 4,220: wave 5 beginning zone and near-term resistance
◌ 4,195: current reaction area
◌ 4,180: short-term support inside the channel
◌ 4,121: first downside confirmation level
◌ 4,071: deeper reaction support
◌ 4,020–4,040: Elliott wave end zone
◌ Above today’s opening resistance: area where the bearish wave 5 setup fails
⌁ Elliott Wave view
From an Elliott Wave perspective, gold appears to be completing the final part of a bearish 5-wave sequence.
Wave 1 started after the rejection from the liquidity imbalance zone.
Wave 2 corrected higher but failed to reclaim the previous structure.
Wave 3 pushed price sharply lower into the 4,121 region.
Wave 4 developed as a small corrective channel.
Wave 5 may now be preparing to extend lower towards the Elliott wave end zone.
If this count is correct, the next move may still be a final downside sweep before the structure becomes more attractive for a larger corrective rebound.
▸ Trading scenario
Preferred scenario: wait for price to stay below the opening resistance and confirm bearish continuation.
Sell reaction zone: 4,195–4,220 if bearish confirmation appears
Stop loss: above the highest resistance from today’s open
Take profit 1: 4,121
Take profit 2: 4,071
Take profit 3: 4,020–4,040
Alternative scenario: if gold breaks above today’s opening resistance and holds with strength, the final wave 5 setup weakens. In that case, the bearish count should be reassessed before looking for continuation.
⌁ Kelly’s view
For Kelly, this is a final-wave structure, not a fresh sell at any price. The downside path is still active, but wave 5 is already late in the sequence, so confirmation matters.
If gold stays below the opening resistance, the market may complete one more downside leg towards the Elliott wave end zone.
Gold is still under pressure.
But if this is truly the final wave 5, the next major reaction may come after the final sweep is complete.
Share your view below.
XAUUSD — EMA Downtrend Holds, Sell Position Remains Active
Fundamental Analysis
Gold remains under pressure as price continues to trade below the main EMA structure. Traders are still watching USD strength, Treasury yields, and upcoming U.S. macro data.
For now, the technical structure still favours sellers while recovery attempts are rejected from the value sell zone.
Technical Analysis
On the 1H chart, XAUUSD is trading below EMA 34, EMA 89, and EMA 200. The EMA structure is still pointing lower, showing that the short-term trend remains bearish.
Price recently tested the value range around 4,210 - 4,225 but failed to break higher. This rejection shows that buyers are still weak, while sellers continue to defend the EMA downtrend.
The order sell zone around 4,185 - 4,204 has also reacted well. After touching this area, price rejected and moved lower again, confirming that the sell zone is still valid.
As long as gold stays below 4,204 - 4,225, the bearish continuation setup remains active. The main downside target is the Fibonacci and liquidity convergence zone around 4,066.
Important Key Levels
Current price area: 4,177
Order sell zone: 4,185 - 4,204
Value range resistance: 4,210 - 4,225
EMA resistance area: 4,234 - 4,270
Short-term support: 4,140 - 4,120
Fibonacci liquidity target: 4,066 - 4,064
Invalidation area: above 4,225
Trading Scenario
Main Sell Scenario
Entry: 4,185 - 4,204
Stop Loss: 4,225
Take Profit 1: 4,140
Take Profit 2: 4,100
Take Profit 3: 4,066 - 4,064
Sell Condition
The preferred setup is to continue focusing on sell positions while price stays below the value range and EMA resistance.
The sell zone has already reacted well, showing rejection from 4,185 - 4,204. If price retests this area and forms another bearish rejection, the sell continuation setup remains valid.
A break below 4,140 would strengthen bearish momentum and open the way toward 4,100, then the Fibonacci liquidity target around 4,066 - 4,064.
Entry Conditions
Wait for price to stay below 4,204.
Look for bearish rejection on any retest.
A break below 4,140 confirms stronger downside pressure.
If price breaks and holds above 4,225, the sell setup is invalid.
Overall, the main view remains bearish while XAUUSD trades below EMA 34, EMA 89, EMA 200, and the value range resistance. The sell zone has already rejected price, so the preferred plan is to continue focusing on bearish continuation toward 4,140, 4,100, and 4,066.
Do you share the same bearish view on gold, or are you waiting for another retest of the order sell zone?
WEEKLY MARKET OUTLOOK – DECISION ZONE APPROACHINGNIFTY 50 – MOMENTUM SLOWS NEAR RESISTANCE
Nifty closed at 24,013, up 391 points from the previous week's close.
Weekly High: 24,189 Weekly Low: 23,817
Once again, Nifty respected my projected range of 24,200–23,150. However, this week the index failed to deliver the strong closing I was looking for and has formed an Evening Star-type structure on the weekly chart, suggesting that momentum may be slowing near resistance and bulls may require stronger participation to continue the recovery.
Nifty Bull Trigger
👉 Sustained trade above 24,189
If achieved, Nifty can move higher toward:
24,322
24,550
A strong weekly close above these levels would significantly improve the higher-timeframe structure and strengthen the case for a move toward higher zones.
Key Support
👉 Below this week's low of 23,817
Bears may attempt to fill the recent gap and retest:
23,600
23,500
Expected Range Next Week
👉 24,550 – 23,600
A breakout or breakdown from this range can bring significant momentum and some fireworks on either side.
BANK NIFTY – STILL LEADING, BUT MOMENTUM COOLING
Bank Nifty closed at 57,685, up around 900 points from the previous week's close.
Bank Nifty continues to be the primary driver of the ongoing recovery, but this week's candle suggests that momentum may be cooling near resistance levels.
Key Levels
👉 Sustain above 58,200
or
👉 Deliver a strong weekly close above 57,800
If achieved, the next upside levels become:
58,950
Higher resistance zones thereafter
Expected Range
58,950 – 56,450
A decisive break on either side can lead to a fast directional move.
TACTICAL VIEW
Current market structure suggests heightened volatility around the middle of the week.
My expectation remains:
25th June Higher probability of a weak/gap-down start
26th June Higher probability of a recovery-led/gap-up opening
These are probability-based expectations derived from current structure and positioning, not certainty. Traders should remain flexible and let price action confirm the move.
S&P 500 – APPROACHING A CRITICAL ZONE
S&P 500 closed at 7,500, around 70 points higher than the previous week's close.
The index remains strong, but it is now approaching an important decision point.
Bullish Trigger
Sustain above 7,585 or deliver a strong weekly close above it
If achieved, the next upside levels are:
7,697 (Important Fibonacci Level)
7,812
7,885
Bearish Scenario
Failure to reclaim and sustain above resistance may lead to the formation of an M-pattern, which is generally considered bearish in nature.
That could provide bears an opportunity to retest lower levels and re-enter the game.
FINAL VIEW
* Nifty: Momentum slowing near resistance
* Bank Nifty: Still leading the recovery
* S&P500: At a critical breakout zone
* Market Structure: Compression before expansion
Markets are approaching a decision zone.
The range is narrowing, volatility is compressing, and the next breakout may be stronger than most expect.
For now:
👉 Respect levels
👉 Stay flexible
👉 Let price confirm the story
AUDCAD | Inflation Supports CAD — Sell Setup Ahead?Recent Canadian inflation data came in stronger than expected, with annual CPI accelerating to 3.2% from 2.8%, while monthly inflation also exceeded expectations. Higher inflation tends to reduce expectations for near-term easing and may provide short-term support to the Canadian Dollar.
From a technical perspective, AUDCAD remains in a broader bullish structure, but price is now approaching an important decision zone.
Price is currently sitting inside a strong supply and resistance area, where the market has rejected multiple times recently — making this region especially interesting to monitor.
In addition, a bearish divergence appears to be developing, suggesting that bullish momentum may be weakening and adding further confluence to the bearish scenario.
From here, two scenarios become relevant:
→ Bearish scenario:
If resistance continues holding and sellers regain control, we may see a bearish rotation supported by stronger CAD sentiment. In this case, downside movement could extend toward the lower boundary of the bullish channel, and if broken downward, focus shifts toward the blue support zone.
→ Bullish scenario:
If price manages to break above the current resistance with convincing momentum and sustain acceptance above the supply area, this may invalidate the short-term bearish thesis and support continuation of the broader bullish trend.
For now, the key question is:
Will CAD strength and divergence trigger a rejection, or will buyers break resistance and continue higher?
This is a scenario-based analysis — not a prediction.
Disclaimer: This analysis is shared for educational purposes only. It reflects personal market observations and does not constitute financial advice or a trading recommendation.
Rayan Nasser
#AUDCAD #AUD #CAD #Forex #TechnicalAnalysis #PriceAction #Inflation #Trading #RiskManagement
Mercedes-Benz Group — Channel Support Under PressureFrom a broader perspective, Mercedes-Benz Group remains in a bearish market structure, continuing to trade inside a descending channel that currently defines the overall directional bias.
At the moment, price is sitting around an important technical area where the lower boundary of the bearish channel aligns with a strong support zone — creating a decisive region that may influence the next directional move.
This area becomes especially interesting because support and channel structure are converging, increasing the probability of a market reaction.
From here, two scenarios become relevant:
→ Bullish corrective scenario:
If price respects the current support and shows signs of rejection, we may see a corrective move higher within the descending channel before the broader trend is reassessed.
→ Bearish continuation scenario:
If support fails to hold and price breaks below the current area with confirmation, further downside may become more probable, with attention shifting toward the next major support zone.
At this stage, the focus is not on predicting a reversal but on observing how price behaves around this decisive location.
For now, the key question is:
Will support trigger a corrective rebound, or will sellers push price toward the next support level?
This is a scenario-based analysis — not a prediction.
Disclaimer: This analysis is shared for educational purposes only. It reflects personal market observations and does not constitute financial advice or a trading recommendation.
Rayan Nasser
#MercedesBenz #Stocks #TechnicalAnalysis #PriceAction #Investing #StockMarket #MarketStructure #RiskManagement
PhysicsWallahI identified this setup last week but waited for confirmation before sharing.
The stock has shown strength and is moving as expected. Based on the current structure, I believe PWL (PhysicsWallah) has the potential to reach 160 and 200 + in the coming weeks or months.
Note: This is my personal analysis and not investment advice. Please do your own research before taking any trade.
Trent !!I identified this setup last week but waited for confirmation before sharing.
The stock has shown strength and is moving as expected. Based on the current structure, I believe Trent has the potential to reach 3500 and 4000+ in the coming weeks or months.
Note - This is my personal analysis and not investment advice. Please do your own research before taking any trade.
Gold (XAUUSD) | Bullish Reversal via MSS & H1 Order BlockOverview
Gold (XAUUSD) has shown a strong structural shift on the lower timeframes following a prolonged corrective phase. After taking out internal liquidity and creating a clear Market Structure Shift (MSS), price is currently reacting to a key demand zone, offering an asymmetric long opportunity.
Technical Breakdown
Market Structure Shift (MSS): Following a bearish run that cleared swing lows, price broke aggressively to the upside, invalidating the previous lower high and establishing an MSS.
Demand Zones:
H1-OB (H1 Order Block): Price is currently mitigating the immediate 1-hour bullish order block where structural buying volume stepped in.
Extreme Pivot Point: Located further down, acting as our ultimate invalidation invalidation floor and major institutional support.
Liquidity & Targets: The bearish Break of Structure (BOS) left behind clean buy-side liquidity pools. These will act as magnets for the current bullish expansion.
Trade Parameters
Entry Zone: Retest and confirmation inside the H1-OB ($4,195 - $4,205 range)
Target 1 (Partial TP): $4,235 (Prior structural lower high)
Full Target (Final TP): $4,253 (Major BOS origin level)
Invalidation (Stop Loss): A clean body close below the Extreme Pivot Point (~$4,170).
SPY's Cross-TF Disagreement Just Entered Its Fourth SessionSPY's Cross-Timeframe Disagreement Just Entered Its Fourth
Session. Neither Side Has Blinked.
The Hourly's bear announcement at CQJ 68.4 has been sitting
there for 24 bars now, still carrying the same conviction it
had when it fired on Wednesday. The Daily's bull announcement
at CQJ 69.97 has been sitting there for 214 bars. One says
the recent move is bearish with real conviction. The other
says the larger trend is bullish and has been saying it for
months. Price is stuck between them at 746.52, inside the
touch-active zone from last week's selloff, with Vol Elev at
1st percentile on the Hourly. Nothing is happening.
The Daily's IMP is still scoring 3/5 in MIXED mode with Vol
Elev at 90th and Open Hour active, the same read it's been
carrying. The Hourly's IMP is 0/5 NONE. The bigger picture
sees institutional participation. The shorter timeframe sees
none. That's been the pattern all week and it hasn't resolved.
Resistance: 748.07 - today's pre-market high
Key resistance: 750.30-752.15 - this week's breakdown origin
Current price: 746.52
Support: 739.80-740.44 - nearest shelf below
Key support: 736.50-738.42 - this week's tested floor
Thesis line: 721.23 - the broader structural floor
Two paths from here:
The Hourly capitulates to the Daily: a fresh bull announcement
fires on the 1H, overriding the 24-bar bear print. Vol Elev
and RCZ climb off the floor. Price clears 750.30 with
participation, reopening the 752-754 zone.
The Daily capitulates to the Hourly: the 214-bar bull
announcement finally gets replaced by a fresh bear print on
the Daily timeframe. IMP loads on a down move, price loses
738.42, opens 732.45-736.50.
Four sessions of disagreement without resolution is unusual.
The longer it persists, the larger the move tends to be when
one side finally gives.
---
Built with SYNTHESIS v3.3 | SOM / ACE / IMP / SYNTHESIS
Study, not financial advice.
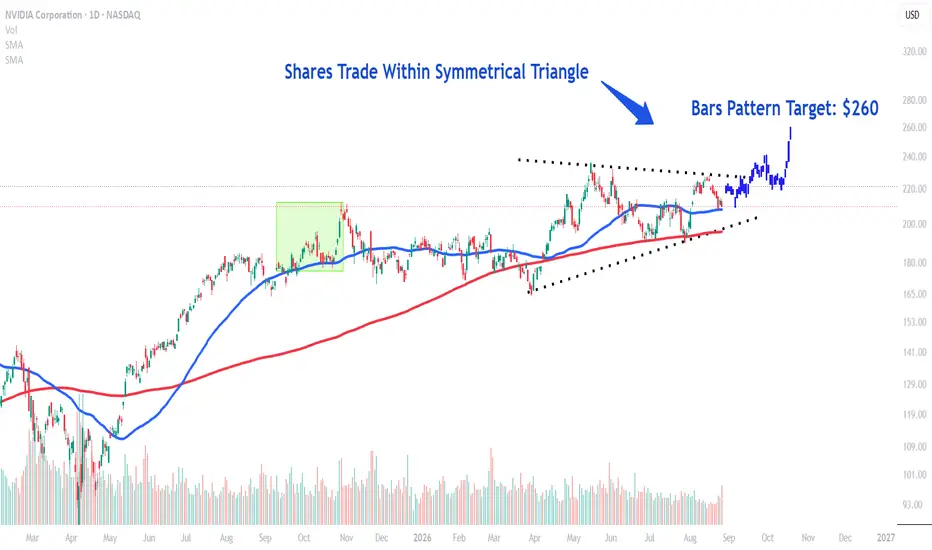
NVDA's Hourly Bull Print Is Still Standing, But...NVDA's Hourly Bull Print Is Still Standing, But Everything Around
It Has Gone Silent.
The 11-bar-old bull announcement at CQJ 55.66 from Thursday's
breakout is still the most recent print. It hasn't been
replaced, but it also hasn't been confirmed by anything. Vol
Elev is at 0th percentile this morning, IMP is 0/5 NONE, RCZ
at 11th. The breakout happened, the system called it bullish,
and then participation vanished. The Daily is still pointing
Q1 LONG with a PARTIAL signal loaded, IMP at 2/5 in MIXED
mode, and ATR at 85th with ATR Expansion flagged, but the
standing Daily announcement is still the same 58-bar bear
print at CQJ 65.03 that has never been overridden. DISBELIEF
is still active on the Daily MIRROR. The Hourly flipped bullish
last week. The Daily still hasn't followed.
Resistance: 210.66-211.85 - nearest overhead
Key resistance: 212.71-213.43 - last week's high cluster
Current price: 210.12
Support: 209.34-210.04 - breakout shelf from last week
Key support: 207.12-208.2 - deeper support
Thesis line: 198.88-199.89 - the June low zone
Two paths from here:
The Daily confirms what the Hourly started: a fresh bull
announcement fires on the Daily to replace the 58-bar bear
print, DISBELIEF clears, the PARTIAL signal upgrades. Vol Elev
climbs off the floor on the Hourly with RCZ following. Price
clears 212.71, opens 213.43.
The Hourly's bull print ages out without backup: Vol Elev stays
at 0, the Daily's bear print outlasts the Hourly's bull print,
price drifts back below 209.34. The breakout that nobody
followed becomes a failed breakout.
The gap between these two outcomes is whether real participation
shows up today. Right now the chart says the move happened, but
the volume says nobody was there for it.
---
Built with SYNTHESIS v3.3 | SOM / ACE / IMP / SYNTHESIS
Study, not financial advice.
BTC's Bear Announcement Has Outlasted Everything Thrown at ItBTC's Bear Announcement Just Crossed 141 Bars. It Has Outlasted
Everything Thrown at It.
This is the same bear print that fired nearly two weeks ago. It
has now survived a Thursday gate activation, a sweep of the prior
low, a full EXT cycle on the Daily, and an overnight bounce from
62,159 back to 64,330 - and the conviction read has not moved.
CQJ 65.59 today, 65.59 when it fired. Most announcements decay
as they age. This one hasn't. That stubbornness is the read.
The 1H is showing something worth paying attention to this
morning: ATR has expanded to 93rd percentile while Vol Elev
sits at only 15th. Range is expanding without volume behind it.
That's thin price action covering a lot of ground, not
institutional participation driving a move. IMP Mode reads EXT
on both the Hourly and the Daily, both timeframes flagging the
move as extended, and the SYNTH Gate is still showing EXT MODE
for what is now the fourth session in a row.
Resistance: 64,400.89 - the shelf overhead
Key resistance: 64,759.19-65,033.53 - next cluster above
Current price: 64,204.79
Support: 63,625.81-63,796.21 - nearest level below
Key support: 62,459.75 - this cycle's tested floor
Thesis line: 59,073.01 - the Daily low
Two paths from here:
The range fills with real volume: Vol Elev climbs from 15th to
match the ATR expansion already underway, IMP moves past 1/5,
price tests 64,400 with participation behind it. A break above
that level with volume would be the first sign the bear print
might finally be wrong.
The thin range contracts: ATR compresses back without Vol Elev
ever confirming, price drifts back toward 63,625, the EXT MODE
flag continues to weigh on any recovery attempt. The 141-bar
bear print ages further without challenge.
ATR at 93rd with Vol Elev at 15th is not a healthy combination
for either direction. It means the chart is moving but nobody
is behind it yet. Whichever side gets real volume first sets
the direction.
---
Built with SYNTHESIS v3.3 | SOM / ACE / IMP / SYNTHESIS
Study, not financial advice.
EURUSD – The Fractal Geometry of the Grand SupercycleIn navigating the current complexity of the EURUSD structure, the divide between our “Aggressive” and “Conservative” scenarios boils down to a question of fractal resolution.
The Aggressive Outlook: We are currently evaluating the potential for an extended Double Zigzag. Should the initial wave indeed manifest as a Leading Diagonal, we must strictly adhere to the internal 5-wave structure of Wave A. We are currently observing the corrective phase with precision, ensuring the integrity of the Wave 2 origin remains intact.
The Conservative Outlook: Our perspective shifts toward a broader Double (or even Triple) Zigzag, suggesting that the impulsive move we anticipate is still in its formative, preparatory stage. The market is currently signaling a transition phase where the alignment between macro-fundamentals and wave mechanics is, quite remarkably, converging.
Technical Markers & Risk Management:
Invalidation Point: We are monitoring the origin of Wave 2 with rigorous discipline. A breach at this level invalidates our current Leading Diagonal interpretation, forcing an immediate, objective structural reassessment.
Impulse Trigger: Keep a laser focus on the corrective channels mapped on the chart. A definitive breach of these channels serves as the “green light” for the next major impulsive leg.
Technical Discipline: Whether we are dealing with a Double or Triple Zigzag, market geometry remains our North Star. If the price action fails to conform to Fibonacci guidelines and wave-degree requirements, we do not force the trade.
Closing Thought: Many market participants dismiss Elliott Wave theory, primarily because it demands immense patience and technical discipline. However, for those of us who follow these patterns, we know the truth: the market never lies; it merely hides its intent in plain sight. The truth of the market is etched within the waves, not in the noise of the headlines.
Euro / U.S. Dollar
Feb 6, 2025
EUR/USD – Bullish Wave & Invalidation Zone
British Pound / U.S. Dollar
Feb 6, 2025
GBP/USD Elliott Wave Analysis – Major Breakout Ahead?