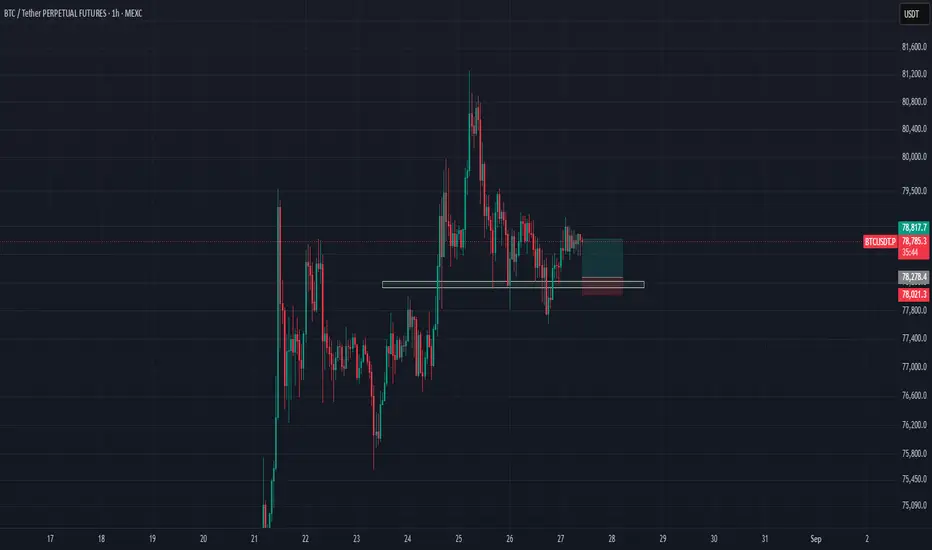
BTC High-Risk Scalp: Key Support Retest (High Risk/2x Potential)Taking a quick, high-risk scalp long off this local horizontal support zone.
While the higher-timeframe structure remains our primary focus, this specific demand block has consistently acted as a strong reaction zone. Ignoring a support level that offers a clean 1:2 Risk-to-Reward ratio is tough to pass up.
Position Size: Very small (High-Risk Scalp)
Strategy: Rebound play off local support
Risk/Reward: 1:2 R:R Target
Execution: Tight stop-loss placed just under the support zone to keep risk fully controlled.
This is a low-exposure, highly tactical trade—strictly stick to risk management! 🌊
⚠️
This analysis is for educational and informational purposes only and does NOT constitute financial, investment, or trading advice. This is a high-risk, speculative scalp play. Always conduct your own research and manage risk according to your personal trading strategy.
Technical Analysis
NZDJPY: Confirmed CHoCH 🇳🇿🇯🇵
I see a valid bearish change of character on NZDJPY on a 4h time frame.
I expect a retracement to 94.5 level.
❤️Please, support my work with like, thank you!❤️
I am part of Trade Nation's Influencer program and receive a monthly fee for using their TradingView charts in my analysis.
XAUUSD: Descending Channel Test & Key 4575 Demand TargetWelcome to today's Gold (XAUUSD) technical update on the M30 timeframe.
Gold is currently riding within a descending channel/wedge pattern. Following a strong rejection at the 4628 – 4638 broken support zone, sellers have driven price down toward our key lower demand target.
🎯 KEY TECHNICAL LEVELS:
⭐ Major Supply Zone (Ceiling): 4658.0 – 4668.0
➤ Primary overhead resistance. As long as price stays capped below this zone, the broader corrective phase remains active.
⭐ Intraday S/R Flip: 4628.0 – 4638.0
➤ Broken support turned intermediate supply. Look for sell scalp continuation if price pulls back to retest this zone.
⭐ Major Demand Zone (Support Floor): 4575.0 – 4587.0
➤ Key structural base aligned with the lower descending channel trendline. This is our primary target for the drop and prime zone for high R:R BUY confirmations.
💡 TRADING STRATEGY:
• Monitor price reaction inside the 4575 – 4587 green demand zone for rejection pinbars or double-bottoms to catch long bounce setups.
• Favor short scalps on any corrective pullbacks toward the 4628 – 4638 resistance zone.
---
⚠️ Disclaimer: This is my personal trading view based on Price Action, not financial advice. Always practice strict risk management.
💬 What is your view on Gold today? Share your thoughts in the comments below!
🚀 Drop a BOOST / LIKE and FOLLOW for daily real-time market updates!
XAGUSD 1H | Retracement into 1H FVG & Demand ZoneXAGUSD is currently showing a short-term pullback after a strong bullish expansion. The broader structure remains important, while price is approaching a key confluence area marked by a **1H Fair Value Gap (FVG)** and a **demand zone**.
### 🔍 Key Areas to Watch
🔹 **Current Price Area:** Price is trading below the recent swing highs after a short-term retracement.
🔹 **Sell-Side Liquidity:** The marked **SSS area** below recent lows may be a key liquidity reference.
🔹 **1H FVG:** The imbalance zone around **66.50–67.00** may attract price before a potential reaction.
🔹 **Demand Zone:** The **65.30–66.50** region is the main decision area highlighted on the chart.
🔹 **Lower 1H FVG:** If the main demand zone fails, the **63.80–64.50** area may become the next important reaction zone.
### 📈 Bullish Scenario
If price sweeps nearby sell-side liquidity and reacts positively from the marked **1H FVG and demand zone**, a recovery toward the **68.40–68.50 area (TP1)** may become possible. Further bullish continuation could then bring the **70.00 area (TP2)** into focus.
### 📉 Bearish Scenario
If price shows sustained acceptance below the marked demand zone, the bullish recovery scenario would weaken. In that case, price may continue toward the lower **1H FVG** for the next potential reaction.
⚠️ **Key Focus:** The marked zones represent areas of interest, not guaranteed reversal points. Price action, liquidity behavior, and market-structure confirmation around these levels may provide additional context.
**This analysis is shared for educational purposes only and does not constitute financial advice or a guarantee of future market performance.**
EUR/NZD BEARS ARE STRONG HERE|SHORT
Hello, Friends!
We are now examining the EUR/NZD pair and we can see that the pair is going up locally while also being in a uptrend on the 1W TF. But there is also a powerful signal from the BB upper band being nearby, indicating that the pair is overbought so we can go short from the resistance line above and a target at 1.950 level.
Disclosure: I am part of Trade Nation's Influencer program and receive a monthly fee for using their TradingView charts in my analysis.
✅LIKE AND COMMENT MY IDEAS✅
GBPJPY 1H | Rising Wedge Breakdown into a Key Demand ZoneGBPJPY is currently approaching an important decision area after rejecting from the upper boundary of a rising wedge.
The broader 1H structure previously showed a series of bullish breaks of structure, but the recent rejection from the wedge highs has shifted attention toward the marked demand zone around 215.80–216.20.
🔍 Key Areas to Watch
🔹 Current Demand Zone: The main area of interest for a potential reaction.
🔹 Rising Wedge: Price has rejected from the upper region, suggesting short-term corrective pressure.
🔹 TP1 Area: Around 216.60, if bullish confirmation develops from demand.
🔹 TP2 Area: Near 217.50, where the next upside reaction could be monitored.
📈 Bullish Scenario
If price reaches the demand zone and shows a clear bullish reaction with confirmation, a recovery toward the TP1 area may become possible. A sustained move higher could then bring the TP2 region into focus.
📉 Bearish Scenario
If the demand zone fails to hold and price accepts below it, the bullish recovery scenario would weaken. In that case, the lower marked demand zone around the 215.00 area may become the next important area to monitor.
⚠️ The key focus is not simply the zone itself, but how price reacts once it reaches it. Waiting for price-action and structure confirmation may provide additional context before considering either scenario.
This analysis is shared for educational purposes only and does not constitute financial advice or a guarantee of future market performance.
EUR/AUD LONG FROM SUPPORT
EUR/AUD SIGNAL
Trade Direction: long
Entry Level: 1.622
Target Level: 1.625
Stop Loss: 1.619
RISK PROFILE
Risk level: medium
Suggested risk: 1%
Timeframe: 1h
Disclosure: I am part of Trade Nation's Influencer program and receive a monthly fee for using their TradingView charts in my analysis.
✅LIKE AND COMMENT MY IDEAS✅
XAUUSD 1H — Bearish Shift, Downside ContinuationThe 1H chart shows a clear change in market structure. Gold previously maintained a strong bullish sequence with multiple BOS formations, but after rejecting the 4,670–4,680 FVG, price formed a CHoCH around 4,600, indicating that bullish momentum has weakened and sellers are gaining control.
📊 Technical Analysis
Current price: ~4,602
Major resistance / supply: 4,650–4,680
Key structure level: 4,600
Near-term support / FVG: 4,550–4,560
Major downside FVG: 4,485–4,515
Price is currently sitting around the 4,600 structural level. A sustained 1H close below this area would strengthen the bearish scenario and could open the way toward the lower FVG zones.
🔴 Bearish Setup
Sell Entry Zone: 4,595–4,605
Prefer confirmation with a 1H candle closing below 4,600 or a bearish retest of the broken level.
Stop Loss: 4,635–4,645
Take Profit 1: 4,560
Take Profit 2: 4,515
Take Profit 3: 4,485
⚠️ Invalidation
If price reclaims 4,635–4,645 and especially breaks back above 4,650, the immediate bearish setup becomes weaker. A sustained move above the upper FVG around 4,680 would invalidate the current bearish structure.
🎯 Market Bias
Bearish below 4,600–4,605.
The chart suggests a potential continuation lower toward 4,560, followed by the larger 4,485–4,515 FVG if selling pressure remains strong.
EUR/USD - Bearish Scenario long termCurrently on EUR/USD, starting from the 12-MONTH timeframe and looking only at the price action of the latest candle, we can see the formation of a Doji. However, there are still around four months left before the yearly candle closes, so we cannot draw any conclusions too quickly.
Moving down to the MONTHLY timeframe, price is currently testing a bearish trendline, just below a resistance level.
My view is that EUR/USD will remain between the 1.15500 and 1.18000 levels until the end of the year. If this scenario plays out, we will most likely confirm the Doji on the 12-MONTH timeframe, which could give us a strong bearish indication for the following year.
For now, I will monitor the price action on the MONTHLY timeframe to see how the next candles close.
Over the coming weeks, I will probably look for trading opportunities that, in any case, remain within the price range mentioned above.
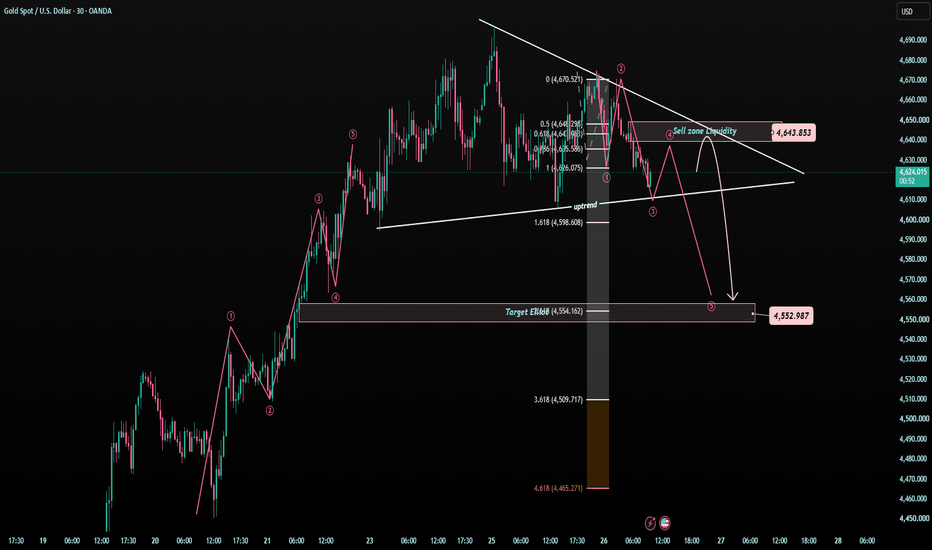
XAUUSD — 4,643 Trap or 4,553 Sweep? Gold is now trading inside XAUUSD — 4,643 Trap or 4,553 Sweep?
Gold is now trading inside a very sensitive compression area.
After the strong bullish run, price is no longer expanding cleanly. The market is now moving between the short-term uptrend support and the descending resistance line.
This is where the next move can become sharp.
The simple read
Gold is currently trading around 4,620 - 4,630.
The first resistance to watch is 4,643.
This area is marked as the Sell Zone / Liquidity Zone and also sits near the short-term downtrend pressure.
If gold pushes into 4,643 and rejects, sellers may try to push price lower toward 4,598 and 4,553.
The 4,553 area is the main downside target zone on the chart.
But if gold breaks and holds above 4,643, the bearish pressure becomes weaker and price may retest 4,670.
Key price zones
Current price area: 4,620 - 4,630
Sell liquidity zone: 4,643
Short-term resistance: 4,670
First downside reaction: 4,598
Main downside target: 4,553
Bullish pressure improves above: 4,643
Bearish pressure increases below: 4,620
Trading plan
Sell reaction scenario
If gold reaches 4,643 and rejects:
This can become the cleanest short-term resistance reaction.
Price may rotate lower toward 4,598 first.
If sellers keep control, 4,553 becomes the next major target zone.
Breakdown scenario
If gold breaks below the uptrend support:
The correction structure becomes stronger.
I will watch for continuation pressure toward 4,598 and 4,553.
Recovery scenario
If gold breaks and holds above 4,643:
The sell setup becomes weaker.
Gold may try to recover toward 4,670 before choosing the next direction.
Tiara’s View
Gold is not in a clean chase zone now.
The market is compressed between support and resistance.
4,643 is the trap zone above.
4,620 is the pressure line below.
4,553 is the main downside target if sellers win this structure.
The clean plan is simple:
Do not chase the middle.
Wait for 4,643 reaction.
Or wait for support breakdown confirmation.
Reaction first.
Confirmation second.
Trade last.
No confirmation = no trade.
Do you think gold will reject from 4,643, or break higher before the next move
Gold is now trading inside a very sensitive compression area.
After the strong bullish run, price is no longer expanding cleanly. The market is now moving between the short-term uptrend support and the descending resistance line.
This is where the next move can become sharp.
The simple read
Gold is currently trading around 4,620 - 4,630.
The first resistance to watch is 4,643.
This area is marked as the Sell Zone / Liquidity Zone and also sits near the short-term downtrend pressure.
If gold pushes into 4,643 and rejects, sellers may try to push price lower toward 4,598 and 4,553.
The 4,553 area is the main downside target zone on the chart.
But if gold breaks and holds above 4,643, the bearish pressure becomes weaker and price may retest 4,670.
Key price zones
Current price area: 4,620 - 4,630
Sell liquidity zone: 4,643
Short-term resistance: 4,670
First downside reaction: 4,598
Main downside target: 4,553
Bullish pressure improves above: 4,643
Bearish pressure increases below: 4,620
Trading plan
Sell reaction scenario
If gold reaches 4,643 and rejects:
This can become the cleanest short-term resistance reaction.
Price may rotate lower toward 4,598 first.
If sellers keep control, 4,553 becomes the next major target zone.
Breakdown scenario
If gold breaks below the uptrend support:
The correction structure becomes stronger.
I will watch for continuation pressure toward 4,598 and 4,553.
Recovery scenario
If gold breaks and holds above 4,643:
The sell setup becomes weaker.
Gold may try to recover toward 4,670 before choosing the next direction.
Tiara’s View
Gold is not in a clean chase zone now.
The market is compressed between support and resistance.
4,643 is the trap zone above.
4,620 is the pressure line below.
4,553 is the main downside target if sellers win this structure.
The clean plan is simple:
Do not chase the middle.
Wait for 4,643 reaction.
Or wait for support breakdown confirmation.
Reaction first.
Confirmation second.
Trade last.
No confirmation = no trade.
Do you think gold will reject from 4,643, or break higher before the next move?
BTC Short-Term Pullback, Long-Term Bullish **BTC: Short-Term Pullback, Long-Term Bullish? 🐂🚀**
The current BTC structure is giving us an interesting picture.
On the **4H**, we have bearish RSI divergence and momentum is cooling off. So I wouldn’t be surprised to see a short-term correction or some sideways chop.
But zoom out to the **1W chart** and the picture becomes much more interesting.
BTC has formed a **bullish RSI divergence** while price made lower lows — suggesting that downside momentum may be weakening.
BTC is also back above the weekly EMA area around **$77K**, which is an important level to watch.
So my view is simple:
📉 **Short term:** A pullback is possible.
📈 **Long term:** The structure remains constructive.
Unless we get a **flash crash or a major breakdown**, I see any normal pullback as noise within the bigger picture.
🔥 **$82K is the key level for the bulls.**
A strong reclaim and hold above $82K would give the bulls the confirmation they need to push the next leg higher.
For me, the bigger timeframe matters more than the short-term noise.
**Stay focused on the structure, not the candles.**
🐂 **Bull Run isn't over until the chart says otherwise.**
#Bitcoin #BTC #Crypto #BitcoinAnalysis #TechnicalAnalysis #BullRun
GBPJPY 1H — Rising Wedge, RSI Divergence & Demand Zone ReactionThe GBPJPY 1H chart remains structurally bullish overall, with price previously confirming multiple Breaks of Structure (BOS) and forming a clear sequence of higher highs and higher lows.
At the current area, however, price is trading inside a Rising Wedge near the recent highs. At the same time, the RSI is showing a potential bearish divergence, where price has pushed higher while momentum has not confirmed the move. This may indicate weakening bullish momentum.
🔍 Key Technical Areas
🔹 Upper Demand Zone:
The first area to monitor if price breaks down from the wedge. A reaction from this zone could support a continuation toward the recent highs.
🔹 Lower Demand Zone:
If the first demand zone fails to hold, the broader lower demand area becomes the next important structure zone to watch for potential buyer reaction.
🔹 Bullish Scenario:
A sustained move above the wedge resistance and recent high could indicate continuation of the existing bullish structure.
🔹 Corrective Scenario:
A breakdown from the Rising Wedge could lead to a retracement toward the marked demand zones before the market establishes its next directional move.
⚠️ Conclusion
The chart currently presents two possible scenarios: continuation after a breakout, or a corrective pullback into demand. Confirmation through price action, market structure, and momentum may provide additional context before assessing the next move.
This analysis is for educational purposes only and represents a technical chart observation, not financial advice.
XAUUSD 15M | Key Decision Zones: 15M OB, PDH & 4H FVGXAUUSD is currently trading around a key short-term decision area after a sharp displacement and market structure shift. The chart shows multiple liquidity and imbalance zones that may influence the next move.
🔹 15M Order Block: Around the 4,658–4,668 area, aligning with a major supply/decision zone.
🔹 PDH: 4,676.72 remains an important external liquidity reference above.
🔹 Sell-Side Liquidity: The 4,650 region is a key level to monitor for a liquidity sweep and reaction.
🔹 Current Demand / 15M OB: The 4,600–4,610 area is an important lower decision zone, supported by a nearby 15M FVG.
📈 Bullish Scenario
If price holds above the current demand area and reclaims nearby short-term structure, the market could revisit the 15M imbalance and order block around 4,658–4,668. A sustained move above that area would bring PDH at 4,676.72 into focus.
📉 Bearish Scenario
If the upside retracement fails and sellers regain control, price may revisit the 4,600 area first. A decisive acceptance below this zone could expose the larger 4H FVG near 4,564.15, followed by the broader 4H order block below.
⚠️ Key idea: The next directional move may depend on how price reacts at the marked 15M order block and liquidity zones. Rather than anticipating direction, it may be useful to wait for confirmation through price action and market structure.
This analysis is for educational purposes and reflects a technical market scenario, not financial advice. 📊
$SPY & $SPX — Levels and Scenarios for Thursday, August 27, 2026🔮 AMEX:SPY & SPCFD:SPX — Levels and Scenarios for Thursday, August 27, 2026
📊 Key U.S. Economic Data (ET)
8:30 AM | Unemployment Claims | Forecast: 208K | Previous: 206K
All Day | Jackson Hole Symposium
⚠️ For informational purposes only. Not financial advice.
📌 #UnemploymentClaims #JacksonHole
XAUUSD – Bearish Wave Toward 4,500
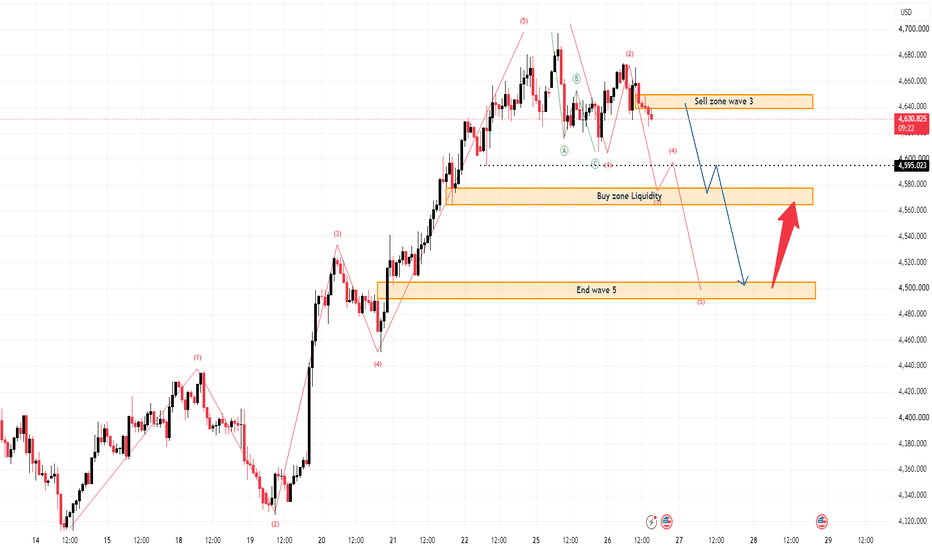
Gold is showing a short-term bearish Elliott Wave structure after failing to extend higher from the recent top. From Kelly’s view, price is now reacting under the wave 3 sell zone, which keeps the downside scenario active. If sellers stay in control, gold could continue lower, first into the liquidity buy zone, then deeper toward the end wave 5 area.
⟡ Market Structure
The current structure suggests gold may be building a fresh downside leg after the rejection near the upper resistance area. Price is now trading around 4,631, while the chart still shows pressure below the 4,638–4,646 sell zone.
As long as gold remains below this zone, the bearish wave sequence stays valid. The first area to watch on the downside is the dotted support near 4,595. If that level gives way, price may continue toward the 4,565–4,578 liquidity zone, where a short corrective bounce could appear before the next leg down.
If the bearish structure continues cleanly, the final downside target remains the 4,498–4,505 end wave 5 zone.
➤ Key Levels
◌ Current price: 4,631
◌ Sell zone wave 3: 4,638–4,646
◌ Intermediate support: 4,595
◌ Buy zone liquidity: 4,565–4,578
◌ End wave 5 target: 4,498–4,505
⌁ Trading Scenario
Primary bearish scenario
Entry: Sell around 4,638–4,646
Stop Loss: Above 4,655
Take Profit 1: 4,595
Take Profit 2: 4,565–4,578
Take Profit 3: 4,498–4,505
This setup follows the idea that gold is still moving inside a bearish wave sequence. A break below 4,595 would strengthen the move toward the lower liquidity area, and a deeper selloff could complete wave 5 near 4,500.
◌ Invalidation
The bearish view becomes weaker if gold reclaims and holds above 4,646–4,655, because that would suggest the current wave-down structure is failing and buyers are regaining control.
▸ Final View
For now, Kelly’s preferred view stays bearish. Gold is still trading under the wave 3 sell zone, so the path of least resistance remains lower unless buyers can reclaim resistance. The cleaner plan is to watch for rejection around the sell zone, then follow the move toward 4,595, 4,565–4,578, and potentially 4,498–4,505.
Do you think gold will complete wave 5 this week, or will buyers defend the liquidity zone first?
XAUUSD – Gold Outlook1️⃣ Market Structure
Gold remains bullish after breaking above the previous resistance zone and maintaining a clear higher-high / higher-low structure.
2️⃣ Liquidity & Price Behaviour
Price is currently trading around 4,638 after a strong expansion.
The nearest liquidity/support area sits around 4,563–4,573, which could attract a short-term retracement before continuation.
3️⃣ Outlook & Bias
Holding 4,563–4,573 → bullish continuation towards 4,660+
A stronger breakout could open the way towards 4,774
Losing this liquidity zone would increase the chance of a deeper correction.
Most probable scenario: A short pullback into liquidity, followed by another bullish expansion.
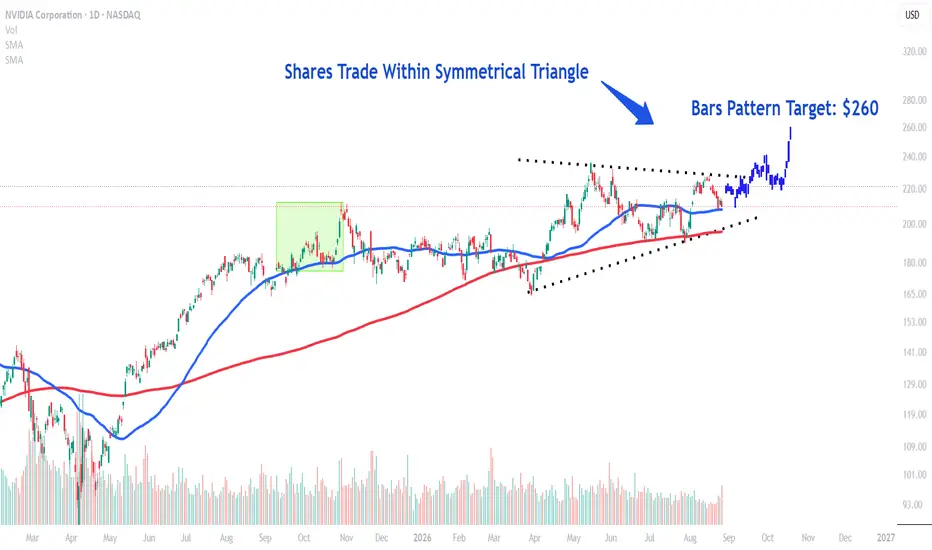
NVDA: Bars Pattern Bullish Target Signals $260Nvidia (NVDA) shares popped 5% in extended trading on Wednesday after the AI favorite posted quarterly results well above Wall Street expectations and issued a strong sales forecast, signaling that the AI boom is showing no signs of slowing.
Taking a closer look at NVDA's chart, the shares have traded within a multi-month symmetrical triangle, potentially indicating accumulation by institutional investors before the stock continues its longer-term uptrend. More recently, the price has retraced to the closely-watched 50 moving average (MA) ahead of today's earnings report.
Traders can project a bullish target by using TradingView's bar pattern tool. To apply the analysis, we take the price bars comprising a move higher following a similar-sized gap after a pullback to the 50 MA in September last year and overlay them from Thursday's projected opening price. This forecasts a move to around $260, implying around 24% upside from Wednesday's closing price.
Bearish Scenario short term - NZD/USDI notice that the latest 12-MONTH candle closed as a bullish hammer. Of course, this observation is only useful for assessing the potential direction over the coming months; for now, we will focus on lower timeframes.
On the MONTHLY timeframe, we are currently trading within a bearish channel, with a strong support level around 0.56000, where price has reacted multiple times over the past few years.
Moving down to the DAILY timeframe, we can see a bullish trend following the bounce from the support mentioned above.
For now, I am waiting for the 3-DAY candle to close for confirmation of a possible short towards the 0.59000 area, where I will then reassess the possibility of another bullish move.
Bearish Scenario short term - USD/CHFOn the MONTHLY timeframe, we are currently in a retracement phase within a bearish channel. Therefore, in the long term, I expect bullish strength in USD/CHF.
In the short term, however, looking at the DAILY timeframe, we are in a bullish trend and channel, which could potentially have a final target around 0.84000.
At the moment, though, the DAILY is in a retracement phase. Therefore, I am waiting for price action confirmation, starting with the 2-WEEK candle close. After that, I will move down to the DAILY / 3-DAY timeframes to look for confirmation closes for a possible short towards 0.79800.
Bearish Scenario - USD/JPYCurrently, the price is trading at a resistance level and near the upper boundary of a MONTHLY channel.
Over the coming days/weeks, the price could consolidate between the 158.000 and 161.000 levels.
I will wait for candle closes on the WEEKLY and 2 WEEK timeframes to get confirmation for a possible short position, targeting the 156.000 level, where we have a DAILY support.
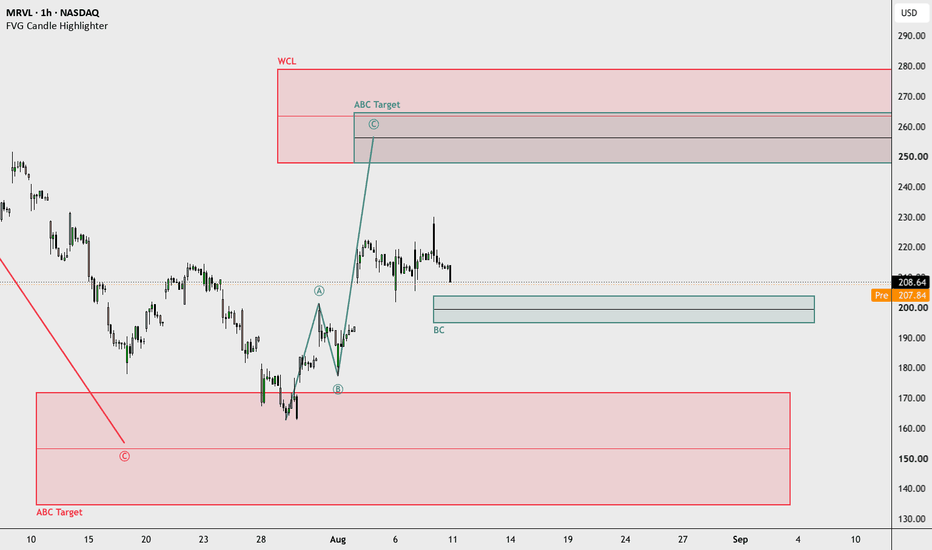
MRVL: Bullish Sequence Target at Point CAfter completing an extended downward move into the lower bearish Point C target zone, NASDAQ:MRVL established a structural floor and transitioned into a new bullish order flow sequence. This initial upward momentum defined clean A and B structural points, laying the foundation for a higher-degree expansion.
Current price action is pulling back toward the designated bullish BC reload zone. Maintaining structural integrity within this demand region allows buyers to absorb localized sell-side liquidity and preserve the upward sequence geometry.
Looking ahead, the primary structural objective sits at the bullish Point C target. Notably, this completion target resides directly within a major macro Whole Correction Level (WCL), marking a high-confluence region for overall sequence balance.
NZD/CAD - Long EntryThe price is currently approaching the 1H bullish trendline. On higher timeframes, we are near a resistance zone that I believe could be broken, potentially leading to a move towards a bearish trendline on the higher timeframes as the target of this trade.
For now, a possible setup could be a long position, with the stop loss placed below the 1H support and a target at 0.83350, just below the higher-timeframe bearish trendline.
EURUSD - Can Sellers Defend the Descending Channel?EURUSD remains bearish from a broader perspective, continuing to trade inside the weekly descending channel.
After rejecting the blue support area and the lower boundary of the channel, price traded higher and is now heading toward the red resistance area, where it aligns with the upper boundary of the descending channel, creating an interesting confluence zone to monitor.
⭕As price approaches this resistance, we can start looking for sell setups on lower timeframes, anticipating a potential rejection and a continuation of the broader bearish trend.
⭕However, if buyers manage to break above the red resistance area and the upper boundary of the descending channel, it would provide an important indication that the broader bearish structure is weakening and that bullish momentum may be gaining strength.
The reaction around this key resistance zone may reveal whether sellers are ready to defend the broader bearish structure, or if buyers have enough strength to push price above the weekly channel.
⚠️ Disclaimer: This analysis reflects my personal market view and is not financial advice.
Rayan Nasser
#EURUSD #EUR #USD #Forex #TechnicalAnalysis #PriceAction #Trading #MarketStructure