Short
Short
Financial Conduct Authority Targets Illegal Crypto TradingThe Financial Conduct Authority (FCA) has launched an enforcement action against three premises suspected of illegal peer-to-peer crypto trading in the UK. This operation, conducted in collaboration with the HM Revenue and Customs (HMRC) and the Metropolitan Police, targets unregistered traders who may facilitate financial crime. Such actions underscore the regulator’s commitment to combating illicit activities within the cryptocurrency sector, as detailed in their official announcement.
The Key Development
The FCA’s recent enforcement action marks a significant step in regulating the cryptocurrency landscape in the UK. The operation aimed at unregistered peer-to-peer crypto traders highlights concerns over the facilitation of financial crimes, including money laundering. By targeting these operations, the FCA seeks to enhance compliance and reduce avenues for criminal activities in the burgeoning crypto market.
Quick Take
FCA targets three premises suspected of illegal peer-to-peer crypto trading. The enforcement action is part of a joint operation with HMRC and the Metropolitan Police. Unregistered traders are viewed as risks for facilitating financial crime. The FCA emphasizes the importance of compliance for crypto businesses. This action reflects increasing scrutiny on the crypto sector in the UK.
Market Pulse
The global cryptocurrency landscape continues to grow, attracting new investors and fostering innovation. However, with this growth comes heightened regulatory scrutiny aimed at preventing financial crime. The FCA’s actions are emblematic of broader trends in regulatory oversight, as governments worldwide seek to ensure that crypto markets operate within legal frameworks designed to protect consumers and the financial system.
The Financial Conduct Authority (FCA) oversees financial markets in the UK, ensuring compliance and protecting consumers from financial crime. Its jurisdiction extends to cryptocurrency activities, particularly as these markets grow and evolve. The FCA has increased its focus on unregistered trading operations to mitigate risks associated with illicit financial activities.
Key Levels to Watch
Traders should monitor regulatory developments closely, particularly in light of the FCA’s recent enforcement actions. As scrutiny increases, compliance will become paramount for crypto businesses operating in the UK. The market may see a shift as unregistered operators face greater risks, potentially leading to a more structured and compliant trading environment in the future.  Long
Long
EMICO ELICON## Emico Elicon Ltd. (CMP ₹2,277.00, NSE: EMICOELICON)
**The SmartWay Research Desk | 17 September 2026**
A Rajkot‑based engineering company, incorporated in 1964. Emico Elicon Ltd. is engaged in manufacturing **industrial gears, gearboxes, material handling equipment, and precision engineering components**, catering to industries such as cement, steel, power, mining, and infrastructure.
**Promoter Holding (Jun 2026):** **Patel Family & Associates — ~73.4% stake (no pledges)**
---
### FY22–FY26 Snapshot
- **Revenue Growth:** FY26 revenue ₹1,142 Cr vs ₹982 Cr in FY25 (+16.3% YoY). → **Good**
- **Net Profit:** FY26 PAT ₹142 Cr vs ₹118 Cr in FY25 (+20.3% YoY). → **Good**
- **Operating Margin:** FY26 EBITDA ₹242 Cr, margin 21.2% vs 20.4% last year (+80 bps). → **Good**
- **Equity Capital:** Stable, face value ₹10. → **Good**
- **Dividend Policy:** Dividend ₹4.00/share declared for FY26. → **Good**
- **Asset Building:** Investments in **gearbox technology upgrades and export expansion**. → **Good**
- **Sales:** Strong demand from **cement, steel, and mining industries**. → **Good**
- **Expense:** Raw material cost pressures (steel, alloys) remain. → **Neutral/Good**
- **EPS:** FY26 EPS ₹28.25 vs ₹23.50 last year (+20.2%). → **Good**
---
### Institutional Interest & Ownership Trends (Jun 2026)
- **Promoter Holding:** ~73.4% (no pledges)
- **FII Holding:** ~2.8%
- **DII Holding:** ~4.6%
- **Retail & Others:** ~19.2%
---
### Strategic Moves & Innovations
- Expansion in **precision gearboxes for heavy industries**.
- Focus on **exports to Europe and Middle East markets**.
- Partnerships with **OEMs for long‑term supply contracts**.
- Diversification into **material handling and automation solutions**.
---
### Cash Flow & Balance Sheet Strength
- Market cap ~₹2,800 Cr.
- Debt‑to‑equity ratio ~0.32 (low leverage).
- Book value per share ₹182.00; P/B ~12.5.
- EPS (TTM) ₹28.25; P/E ~80.6.
---
### Risk Factors
- Very high **P/E ratio ~80.6**, valuations extremely expensive.
- Dependence on **industrial demand cycles (cement, steel, mining)**.
- Exposure to **commodity price volatility (steel, alloys)**.
- Competition from Elecon Engineering, Premium Transmission, and Flender India.
---
### Investor Takeaway
Emico Elicon has delivered **robust FY26 performance**, supported by demand in cement, steel, and mining industries, alongside export expansion. With strong promoter backing (Patel Family, 73.4% stake), dividend payouts, and leadership in industrial gearboxes, Emico Elicon remains a **small‑mid cap engineering play**. At CMP ₹2,277.00, valuations are **extremely expensive (P/E ~80.6, P/B ~12.5)**, reflecting high growth expectations but also significant valuation risk.  Long
Long
Long 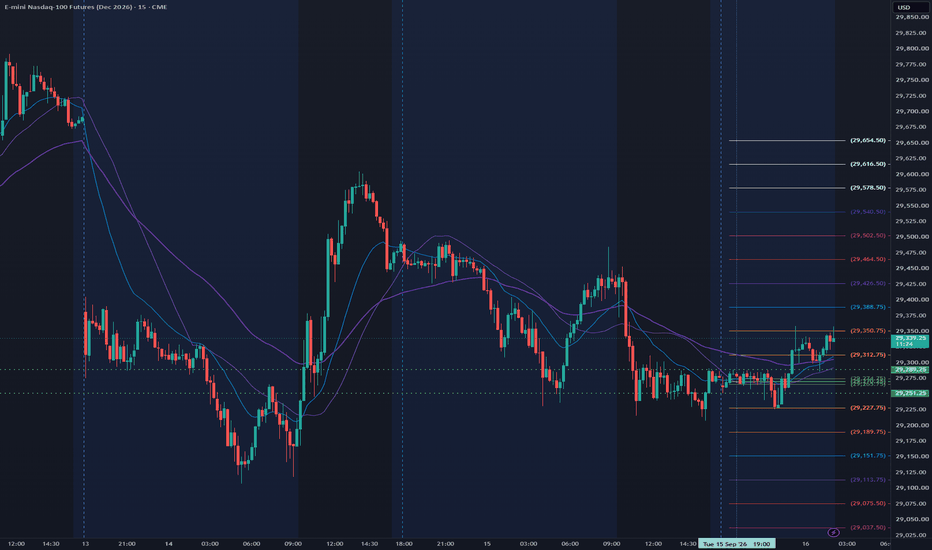
Diamondback Energy Has Been CoilingDiamondback Energy has consolidated as crude oil rallies, and some traders may see potential for a breakout.
The first pattern on today’s chart is the July 2024 high of $214.50. FANG broke the old peak last month before pulling back. Is another push coming?
Second, the oil-and-gas driller made higher lows above its rising 50-day simple moving average after testing the old resistance. That could reflect bullish intermediate-term price action.
Third, Bollinger Bandwidth has narrowed as the stock forms the tighter range. That volatility squeeze may create potential for prices to expand.
Finally, the 8-day exponential moving average (EMA) has mostly stayed above the 21-day EMA since early July. That could be consistent with growing bullishness in the short term.
TradeStation has, for decades, advanced the trading industry, providing access to stocks, options and futures. If you're born to trade, we could be for you. Learn more here about TradingView’s Broker of the Year!
Past performance, whether actual or indicated by historical tests of strategies, is no guarantee of future performance or success. There is a possibility that you may sustain a loss equal to or greater than your entire investment regardless of which asset class you trade (equities, options or futures); therefore, you should not invest or risk money that you cannot afford to lose. Online trading is not suitable for all investors. View the document titled Characteristics and Risks of Standardized Options at www.TradeStation.com . Before trading any asset class, customers must read the relevant risk disclosure statements on www.TradeStation.com . System access and trade placement and execution may be delayed or fail due to market volatility and volume, quote delays, system and software errors, Internet traffic, outages and other factors.
Securities and futures trading is offered to self-directed customers by TradeStation Securities, Inc., a broker-dealer registered with the Securities and Exchange Commission and a futures commission merchant licensed with the Commodity Futures Trading Commission). TradeStation Securities is a member of the Financial Industry Regulatory Authority, the National Futures Association, and a number of exchanges.
TradeStation Securities, Inc. and TradeStation Technologies, Inc. are each wholly owned subsidiaries of TradeStation Group, Inc., both operating, and providing products and services, under the TradeStation brand and trademark. When applying for, or purchasing, accounts, subscriptions, products and services, it is important that you know which company you will be dealing with. Visit www.TradeStation.com for further important information explaining what this means. AI Wobble Leaves US 100 Sentiment on a Knife EdgeIts already been a tough start to the week for technology stocks in the US 100 index as traders reacted negatively on Monday to the shock proposal made over the weekend by influential Anthropic CEO Dario Amodei, who urged the AI industry to slow the development of its most advanced models in order for adequate guardrails to be put in place, comments further supported by Sam Altman of OpenAI and Elon Musk.
The fallout saw chipmaker stocks within the US 100, leading the index down from a close at 29370 on Friday to a low of 28804 yesterday afternoon, a drop of 1.9% before some fresh demand resurfaced. Chipmakers were hit especially hard on concerns that a slowdown in AI development could lead to a reuction in AI capital expenditure which has been the major factor driving their value to numerous record highs.
If this wasn’t enough of a challenge for stock traders to negotiate this week, sentiment remains on a knife edge ahead of the Federal Reserve (Fed) interest rate decision, which is due for release on Wednesday at 1900 BST. Economists and investors are divided on whether the Fed decides to hike rates for the first time in 2026 to stem the immediate threat from rising inflation or keep rates unchanged to allow policymakers to analyse another month of key data readings. As a rule, Fed rate hikes tend to weigh on technology/growth stocks in the US 100 index as it makes borrowing more expensive.
Whatever the Fed decides, the press conference, which commences at 1930 BST on Wednesday, could also be a volatility flashpoint for US 100 prices, as traders respond to Fed Chair Kevin Warsh’s comments on inflation and future rate moves into the end of 2026.
Technical Update: Decision Making Process Develops:
The technical picture for the US 100 index continues to reflect an uncertain sentiment backdrop, with the latest upside recovery failing at 30246 (August 17th high), still well below the June 1st all-time high at 30656. Some traders may view this price action as a weak test of the previous 30656 extreme, which could be a negative for future directional moves.
However, as the chart above shows, since mid‑August prices have traced out a period of sideways movement between 28873 (August 24th low) and 29749 (August 28th high). This type of more balanced activity may be viewed as a decision‑making process, with a closing breakout from the price range required to suggest where the next directional risks could lie.
Potential Support Levels:
With 28873 (August 24th low) potentially marking the lower extreme of the current sideways trading range, this level may be viewed as the first key support. Closing breaks below 28873, if seen, could develop the possibility of negative momentum reemerging.
Closing breaks below 28873 could suggest the decision‑making process has been resolved to the downside, resulting in further price weakness and tests of support at 27050 (July 29th low). Closing breaks below 27050 could open potential for moves toward 26714 (50% Fibonacci retracement of the March 31st to June 1st strength), even 25830 (61.8% retracement).
Potential Resistance Levels:
Currently the sideways price range still remains intact, with the upper extremes potentially marked by resistance at 29749 (August 28th high). Therefore, if this sideways activity is to be resolved in a positive way, it may be reflected by closes above 29749, which could lead to further attempts at price strength.
Closes above 29749, if seen, could lead to further price upside momentum to challenge the August 17th high at 30246. If this level were also broken on a closing basis, price moves could extend toward the June 1st all‑time high at 30656.
The material provided here has not been prepared accordance with legal requirements designed to promote the independence of investment research and as such is considered to be a marketing communication. Whilst it is not subject to any prohibition on dealing ahead of the dissemination of investment research, we will not seek to take any advantage before providing it to our clients.
Pepperstone doesn’t represent that the material provided here is accurate, current or complete, and therefore shouldn’t be relied upon as such. The information, whether from a third party or not, isn’t to be considered as a recommendation; or an offer to buy or sell; or the solicitation of an offer to buy or sell any security, financial product or instrument; or to participate in any particular trading strategy. It does not take into account readers’ financial situation or investment objectives. We advise any readers of this content to seek their own advice. Without the approval of Pepperstone, reproduction or redistribution of this information isn’t permitted.  Long
Long
Oil (WTI) – No Rest From Unscheduled Headline Driven VolatilityFor Oil (WTI) traders, rarely does a day go by without a fresh headline hitting their screens about the constantly changing geopolitical situation in the Middle East which could generate further volatility for prices. Weekends can be particularly challenging with a lot of conflicting information for traders to digest and then assess to determine whether prices open near to Friday’s closing levels or gap higher or lower. This weekend was no exception.
Fighting has intensified and broadened across the Middle East region in recent days as Iran backed Houthi rebels step up drone attacks on Saudi Arabian energy infrastructure in an attempt to seal off an important oil pipeline toward the Red Sea, a supply channel that has reached its full capacity of around 7 million barrels per day while the Strait of Hormuz has remained closed to the majority of tanker traffic. Oil prices closed at 100.32 on Friday, but after news that Saudi Arabia kept this key pipeline shut as a precaution over the weekend, prices surged quickly on today’s open up to a high of 103.80 before cooling slightly back down to current levels around 102.80 at the time of writing (0745 BST).
Traders may have to remain nimble this week as the news flow from the Middle East intensifies again. A pivotal event for Oil prices could whether a meeting of top diplomats from the 6 member Gulf Co-operation Council with their Iranian counterpart eventually goes ahead. The meeting, an attempt by Oman and Iran to secure a temporary deal to allow tanker shipping to safely pass through the Strait of Hormuz, was initially scheduled for later today but was postponed at the last minute without any further details on when the meeting could next take place.
In this headline driven environment, taking a step back to assess the wider technical backdrop and identify some potentially important support and resistance levels that may have an influence on the speed and direction of future Oil (WTI) moves could be productive.
Technical Update: Can the Recent Upside Acceleration Continue?
Oil (WTI) has experienced a clear increase in price volatility in recent weeks, with geopolitical news continuing to drive investor sentiment. This prompted a 30% rise in prices from the August 26th low of 80.32 up to the September 11th high at 104.72, before falling back to close the week at 100.32
It’s possible that Friday’s setback could merely have been an attempt to unwind short‑term upside extremes into the weekend and prices may resume their push to higher levels again, however it could also mark a top to the recent rally from which fresh downside could reemerge.
Of course, much will depend on future headlines from the US-Iran conflict. However, below we outline what may be the important levels to focus on over the coming week.
Potential Key Resistance Levels:
Having seen last Friday’s initial price strength capped by 104.72, which proved to be the session high, this could be the first key resistance level for traders to focus on. If the recent strength in Oil (WTI) prices is to resume, closing breaks above 104.72 may be required to achieve it.
Successful closing breaks above 104.72 could open scope for moves to 109.55, the May 18th high and if this level were also broken on a closing basis, 113.29, which is the April 30th high.
Potential Key Support Levels:
It’s too early to know for sure if Friday’s decline could be the start of a more prolonged phase of price weakness, and closing breaks below potential support levels may be required for this theme to develop further. As the chart below shows, the first support level for traders to focus on could be 95.34, which is the 38.2% Fibonacci retracement of the August 26th to September 11th high.
If closing breaks below 95.34 (38% retracement) are seen, it could lead to further price declines toward the next potential support at 92.46 (50% retracement), then 89.57 (61.8% level).
The material provided here has not been prepared accordance with legal requirements designed to promote the independence of investment research and as such is considered to be a marketing communication. Whilst it is not subject to any prohibition on dealing ahead of the dissemination of investment research, we will not seek to take any advantage before providing it to our clients.
Pepperstone doesn’t represent that the material provided here is accurate, current or complete, and therefore shouldn’t be relied upon as such. The information, whether from a third party or not, isn’t to be considered as a recommendation; or an offer to buy or sell; or the solicitation of an offer to buy or sell any security, financial product or instrument; or to participate in any particular trading strategy. It does not take into account readers’ financial situation or investment objectives. We advise any readers of this content to seek their own advice. Without the approval of Pepperstone, reproduction or redistribution of this information isn’t permitted. Overview: A Reversal Strategy for Trading on the Daily Timeframe
🍀Overview
Hi all, I recently completed a Pine Script strategy designed for trading on the daily timeframe.
I’m not a discretionary technical analyst, so I rely on predefined setups. I turn the rules into a strategy to make the process systematic and repeatable.
The strategy includes several parameters, which are now finalized. The rules will remain unchanged unless an adjustment is genuinely necessary.
Because the strategy was completed recently, it has already opened positions in several tickers. For those initial posts, the trade will be documented retrospectively and will be followed until the strategy exits or a discretionary exit is executed according to predefined rules.
For future entries, a separate idea will be published when the strategy opens a position, following it through to the exit.
Let's go through the strategy and use SPY as an example.
🍀Assumptions
This is a long-only strategy built on the assumption that the underlying instruments will appreciate over time.
It aims to capitalize on price fluctuations by establishing long positions when a stock trades at a discount.
If this growth assumption fails to hold, the strategy is unlikely to perform well. Consequently, the current focus is on instruments like SPY and Nasdaq-100 stocks, with potential expansion to other assets in the future.
🍀Strategy
Tickers : SPY, Nasdaq-100 stocks
Date : When the setup triggers
Timeframe : Daily
Direction : Long
Strategy : Reversal Strategy
Strategy Overview : Overview: A Reversal Strategy for Trading on the Daily Timeframe
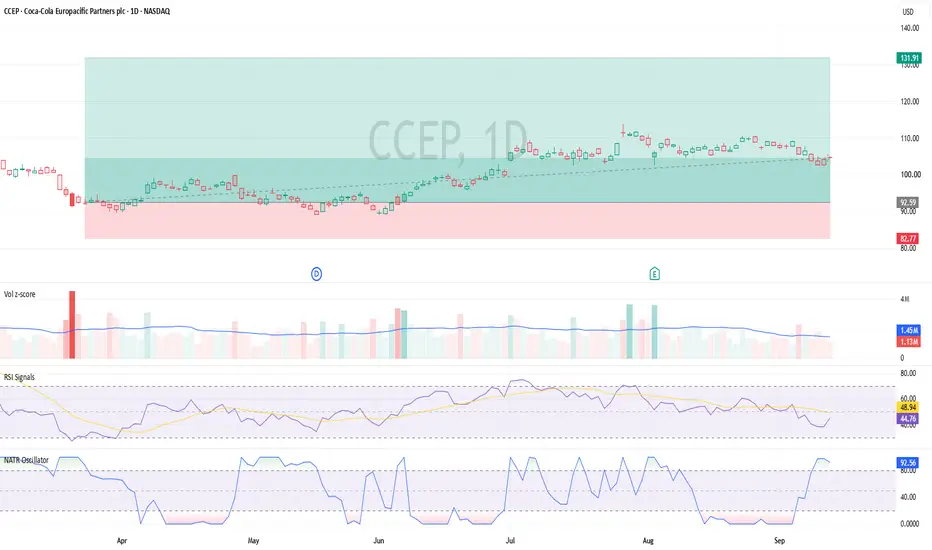
Strategy Chart : Please refer to the 2nd screenshot
Indicators
RSI Signals : This is built on top of TradingView's original RSI indicator. It preserves the original RSI calculation and visualization while adding customizable overbought/oversold exit signals directly on the main price chart.
NATR Oscillator : The NATR Oscillator converts Normalized Average True Range into a rolling 0–100 oscillator. NATR is calculated as ATR divided by the current closing price and expressed as a percentage. The indicator then compares the current NATR with the highest and lowest NATR readings over the selected lookback period.
Signals
Main signal: RSI Signals
Long setup: RSI crosses above 30
Short setup: RSI crosses below 70
Confirmation signal: NATR Oscillator
NATR Oscillator >= 80
Signal Scoring
Main signal score: 0.5
Confirmation signal score: 0.5
Setup score = Main signal score + Confirmation signal score
Entry threshold: 1.0
Risk Management
Reward-to-risk ratio: 4:1
Entry: The close of the candle that triggers the setup
Stop distance: approximately 4x daily ATR
Target distance: approximately 16x daily ATR
Order Management : Bracket order
Limit entry
Market stop
Limit target
Baseline
Assume the worst has already happened: the stop loss has been reached.
Alerts
The strategy can be configured to fire an alert whenever a setup occurs, long or short, regardless of whether it is currently holding a position.
Rules
A setup occurs when both signals appear at the same time.
The strategy enters when the setup score is greater than or equal to the entry threshold.
The strategy must not currently be in a position.
One entry, one exit. No scaling in or out.
Unfilled entry: If the entry is not filled and price reaches the target first, the bracket order is cancelled. The strategy treats this as a missed setup and waits for the next one.
Optional discretionary exit: If an opposite signal or short setup appears and the reward is at least 2R, the position can be exited.
🍀Visualization
Please refer to the 2nd screenshot
Pane 1: Price Chart
Bracket order visualization (a simplified version compared with TradingView's long/short position drawing tools)
Green zone: profit zone
Red zone: loss zone
Middle gray line: entry price
Labels
Entry label: entry price
Stop label: stop price and stop distance
Target label: target price and target distance
Shapes
Green triangles: Long setups
Red triangles: Short setups
Pane 2: Volume Z-Score
It compares the current volume with its recent average and standard deviation to identify unusually extra high, high, normal, or below-normal volume.
Shown for completeness and does not affect the strategy.
Pane 3: RSI Signals
Pane 4: NATR Oscillator
Pane 5: Reversal Strategy
Static lines
Green line: long setup threshold, currently 1.0
Red line: short setup threshold, currently 1.0
Dynamic lines
Green line: long setup score for that candle
Red line: short setup score for that candle
Peaks
Green peak: a long setup occurs when it touches or crosses the long threshold
Red peak: a short setup occurs when it touches or crosses the short threshold
Table
Ticker
Bias: long setup score > short setup score is Long bias ; reverse is Short bias ; otherwise Tie
L/S scores (thres): long/short scores and thresholds on the latest candle
Stop/target dist: stop and target distances if entering a position, currently 4x daily ATR for the stop and 16x daily ATR for the target
🍀Example: SPY
This setup occurred before the strategy was developed. The trade is documented retrospectively and will be followed until the strategy exits or a discretionary exit is executed according to predefined rules.
☘️Process
Ticker : AMEX:SPY
Date : 09/04/2025
Timeframe : Daily
Direction : Long
Strategy : Reversal Strategy
Strategy Overview : Overview: A Reversal Strategy for Trading on the Daily Timeframe
Strategy Chart : Please refer to the 2nd screenshot
Signals
Main signal: RSI Signals crossed above 30, indicating an exit from the oversold zone. This contributed a score of 0.5
Confirmation signal: NATR Oscillator reached 100, exceeding the required threshold of 80. This contributed a score of 0.5
Signal Scoring
Main signal score = 0.5
Confirmation signal score = 0.5
Long setup score = main signal score + confirmation signal score = 0.5 + 0.5 = 1.0
Long score threshold: 1.0
The long setup score met the required threshold. The strategy therefore placed a long bracket order.
Risk Management
Reward-to-risk ratio: 4:1
Entry: 548.62 (the close of the setup candle)
Stop distance: 64.25 (approximately 4x daily ATR)
Target distance: 257.01 (approximately 16x daily ATR)
Order Management : Bracket order
Limit entry: 548.62
Market stop: 484.37
Limit target: 805.63
Baseline
Assume the worst has already happened: the stop loss has been reached.
☘️Outcome
Trade Execution
09/04/2025: The daily candle closed, triggering the strategy to place a long bracket order.
10/04/2025: Price reached the trigger level, and the long entry filled.
Trade Status
Trading: active
P.S. I’m currently applying this strategy to the Nasdaq-100. Let me know which stock you’d like me to look at next.
Stay lucky!🍀
 Education
$GLD — Sep 11 closeAMEX:GLD — Sep 11 close
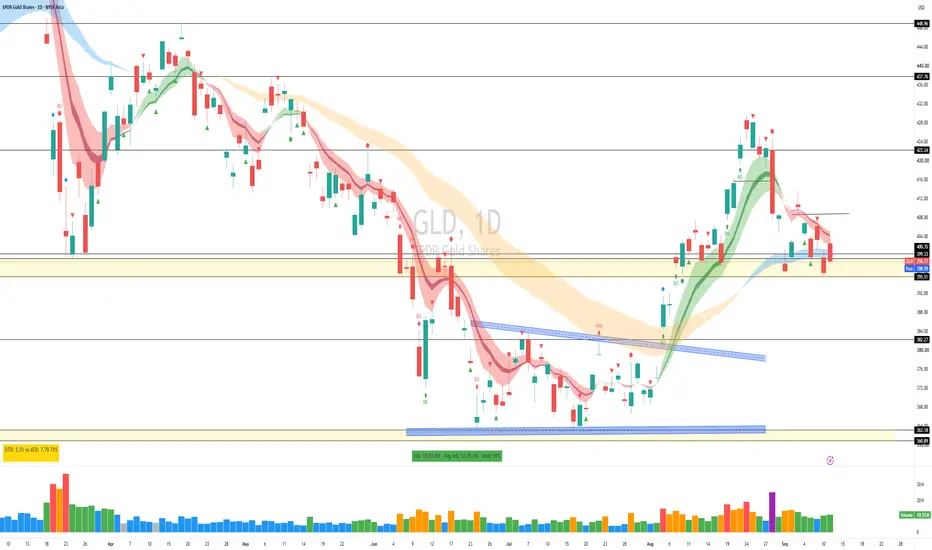
This one is worth paying attention to. Two red candles in a row — one on a down day, one on an up day — both with increasing volume. Buyers are trying their best to lift this market and something is going on underneath.
Today shows it clearly. Gapped up to 403.65 on the print, then got sold all day to close 398.77, right near the low and back under 400. Volume rose again. Effort with no result — that's supply meeting every rally.
Fundamentally, CPI m/m came in hot, and the market went up and then straight back down. It tricked players on both sides.
AMEX:GLD closed below the 400 psych level. Below here the ladder is 390, 385, 380.
But here's what's interesting, and it cuts the other way. On the weekly, we have two Tests sitting right on the 34/50 cloud (@ripster47 EMA cloud) — and this week printed above-average volume with a below-average range, closing off the low. Heavy volume that produces almost no movement means someone is absorbing the selling.
So the daily says supply is capping rallies. The weekly says something is buying this level. That's why price is stuck.
The line settling it is 395.51 — the weekly 34/50 and the Stopping Volume low together. It has not broken on a close. Today's low was 398.14, a higher low.
400 is the key and this is the pivot. Lose 395.51 on a close and the 390/385/380 ladder is live. Hold it and reclaim the 5-12 cloud (@ripster47 EMA cloud) and the weekly absorption wins.
One more thing to keep in mind — if we get a ceasefire between Iran and the US, that cools gold fast. Watch the headlines as much as the chart.
Trigger down: close under 395.51. Trigger up: 5-12 Curl. Short