Cập nhật
Average Daily Range (ADR) Levels
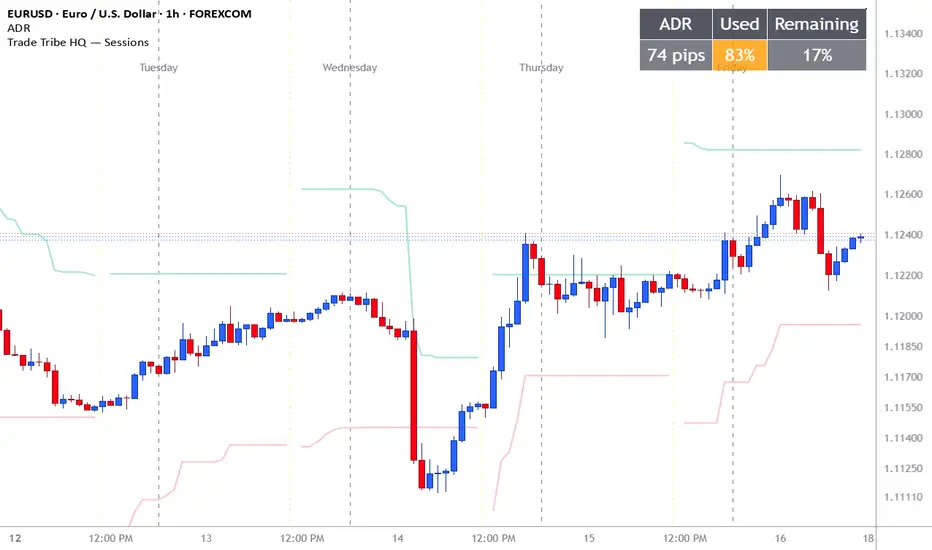
This indicator plots the Average Daily Range (ADR) as projected high and low levels for the current trading day, so you can see how much of a typical day’s movement price has already covered.
What it does
Calculates the average high-to-low range of the last [5 / 14 / user-defined] completed daily candles
Projects ADR high and ADR low levels from the [daily open / current day’s low and high]
Shows the percentage of the ADR used so far today [if your script includes this]
Optionally displays [half-ADR levels / previous day’s levels / a table, depending on what yours includes]
How it’s calculated
ADR = the sum of (daily high − daily low) over the lookback period, divided by the lookback length. The script uses completed daily bars only, so the levels don’t repaint during the session. Projections are anchored to [the daily open / the running intraday high and low, which means the levels adjust as the day’s range expands].
How to use it
ADR gives context for how far price is likely to travel in a normal session. Traders commonly use it to:
Judge whether a move is stretched once price nears or exceeds 100% of ADR
Set realistic profit targets inside the day’s expected range
Avoid chasing entries late in the day after most of the range is used
Compare current volatility to recent averages
ADR describes past volatility. It doesn’t predict direction, and price can and does exceed the average range, especially around news events.
Works on intraday timeframes. Daily data is pulled with request.security.
What it does
Calculates the average high-to-low range of the last [5 / 14 / user-defined] completed daily candles
Projects ADR high and ADR low levels from the [daily open / current day’s low and high]
Shows the percentage of the ADR used so far today [if your script includes this]
Optionally displays [half-ADR levels / previous day’s levels / a table, depending on what yours includes]
How it’s calculated
ADR = the sum of (daily high − daily low) over the lookback period, divided by the lookback length. The script uses completed daily bars only, so the levels don’t repaint during the session. Projections are anchored to [the daily open / the running intraday high and low, which means the levels adjust as the day’s range expands].
How to use it
ADR gives context for how far price is likely to travel in a normal session. Traders commonly use it to:
Judge whether a move is stretched once price nears or exceeds 100% of ADR
Set realistic profit targets inside the day’s expected range
Avoid chasing entries late in the day after most of the range is used
Compare current volatility to recent averages
ADR describes past volatility. It doesn’t predict direction, and price can and does exceed the average range, especially around news events.
Works on intraday timeframes. Daily data is pulled with request.security.
Phát hành các Ghi chú
This indicator shows the Average Daily Range (ADR) and how much of it the current day has already covered, in a table and as projected levels on the chart.How it’s calculated
ADR is the simple average of (daily high − daily low) over the last 14 completed daily candles (adjustable). The current day is excluded from the average, so the value doesn’t change during the session. Today’s high and low are tracked bar by bar on the chart timeframe.
What it shows
• ADR value: pips on forex (JPY-quoted pairs handled), points on futures, indices, stocks, and crypto
• Used %: today’s range as a percentage of ADR. The cell turns orange at the warning threshold (default 80%) and red at 100%
• Remaining %: how much of the average range is left
• ADR High line: today’s low + ADR
• ADR Low line: today’s high − ADR
The projection lines move as the day’s range expands. They mark where price would be if the day reached a full average range from its current extreme.
How to use it
ADR gives context for how far price typically travels in a session. Traders use it to judge when a move is stretched, set targets within the expected range, and avoid chasing late entries after most of the range is used. ADR measures past volatility. It doesn’t predict direction, and price can exceed the average range, especially around news.
Settings
ADR length, warning threshold, projection lines on/off and colors, table position, text size, Remaining % column on/off.
Release Notes
Added optional ADR projection lines (today’s low + ADR, today’s high − ADR). Added a color warning on the Used % cell with an adjustable threshold. Non-forex symbols now display ADR in points instead of pips. Today’s high and low are now calculated on the chart timeframe to avoid lookahead on historical bars.

Thông báo miễn trừ trách nhiệm
Thông tin và các ấn phẩm này không nhằm mục đích, và không cấu thành, lời khuyên hoặc khuyến nghị về tài chính, đầu tư, giao dịch hay các loại khác do TradingView cung cấp hoặc xác nhận. Đọc thêm tại Điều khoản Sử dụng.
Thông báo miễn trừ trách nhiệm
Thông tin và các ấn phẩm này không nhằm mục đích, và không cấu thành, lời khuyên hoặc khuyến nghị về tài chính, đầu tư, giao dịch hay các loại khác do TradingView cung cấp hoặc xác nhận. Đọc thêm tại Điều khoản Sử dụng.