OPEN-SOURCE SCRIPT
Cập nhật SWIFTEDGE DAX
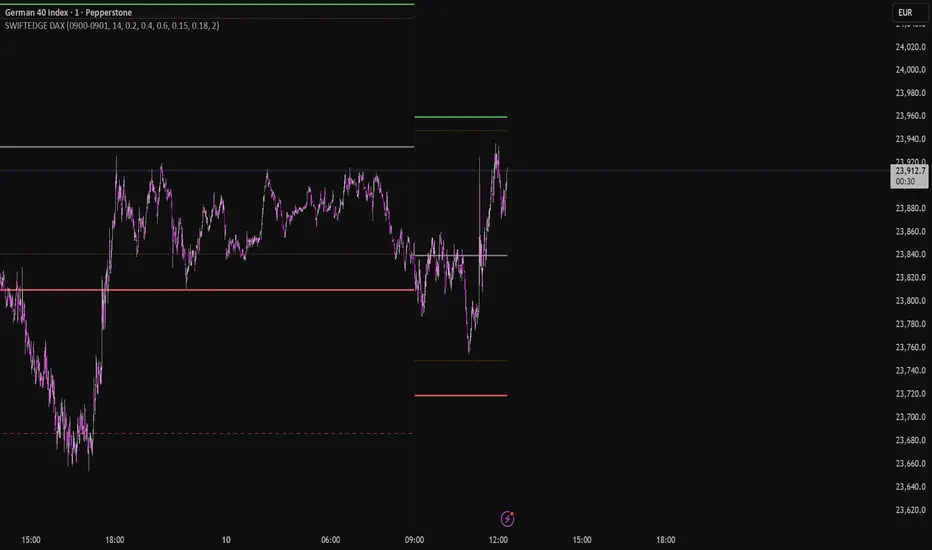
DAX Intraday ATR Bias Levels
Overview
This indicator is designed for intraday traders focusing on the DAX (GER40). It visualizes the relationship between market noise and directional trends by anchoring to the Frankfurt Open (09:00 CET) and projecting dynamic levels based on the asset's current volatility (Average True Range).
The Logic Behind the 09:00 Anchor
The 09:00 CET timestamp marks the official opening of the Xetra exchange, bringing the highest surge in volume and liquidity to the DAX. By fixing the "anchor point" at this specific moment, the indicator establishes an objective baseline for the day’s price action, filtering out the lower-volume noise from the overnight sessions.
Key Features & Methodology
The system utilizes a 14-day Average True Range (ATR) to calculate and plot levels that adapt to changing market environments:
Standard Targets (TP1 - 0.2x ATR): Represents the most frequent daily expansion levels.
Trend Targets (TP2 & TP3 - 0.4x & 0.6x ATR): Visualizes extended levels typically reached during high-conviction trend days or periods of increased volatility.
Median MAE (Maximum Adverse Excursion): The orange dotted lines represent statistical "normal" retracement zones. These lines help traders distinguish between a standard pullback and a potential trend failure. By visualizing the median MAE, traders can remain patient during minor fluctuations.
Visual Guide
Gray Line: Frankfurt Open Price (09:00).
Green Lines (Upward): Projected targets for Long-bias scenarios.
Red Lines (Downward): Projected targets for Short-bias scenarios.
Orange Dotted Lines: Statistical retracement thresholds (0.15 for long / 0.18 for short bias).
How to Use
This tool is intended as a visual decision-support system. It helps traders identify:
When a breakout from the open is statistically "overstretched."
Where to expect potential pullbacks (MAE) before a target is reached.
Objective profit-taking zones based on actual market volatility rather than fixed point values.
Disclaimer: This tool is for educational and analytical purposes only and does not constitute financial advice.
Overview
This indicator is designed for intraday traders focusing on the DAX (GER40). It visualizes the relationship between market noise and directional trends by anchoring to the Frankfurt Open (09:00 CET) and projecting dynamic levels based on the asset's current volatility (Average True Range).
The Logic Behind the 09:00 Anchor
The 09:00 CET timestamp marks the official opening of the Xetra exchange, bringing the highest surge in volume and liquidity to the DAX. By fixing the "anchor point" at this specific moment, the indicator establishes an objective baseline for the day’s price action, filtering out the lower-volume noise from the overnight sessions.
Key Features & Methodology
The system utilizes a 14-day Average True Range (ATR) to calculate and plot levels that adapt to changing market environments:
Standard Targets (TP1 - 0.2x ATR): Represents the most frequent daily expansion levels.
Trend Targets (TP2 & TP3 - 0.4x & 0.6x ATR): Visualizes extended levels typically reached during high-conviction trend days or periods of increased volatility.
Median MAE (Maximum Adverse Excursion): The orange dotted lines represent statistical "normal" retracement zones. These lines help traders distinguish between a standard pullback and a potential trend failure. By visualizing the median MAE, traders can remain patient during minor fluctuations.
Visual Guide
Gray Line: Frankfurt Open Price (09:00).
Green Lines (Upward): Projected targets for Long-bias scenarios.
Red Lines (Downward): Projected targets for Short-bias scenarios.
Orange Dotted Lines: Statistical retracement thresholds (0.15 for long / 0.18 for short bias).
How to Use
This tool is intended as a visual decision-support system. It helps traders identify:
When a breakout from the open is statistically "overstretched."
Where to expect potential pullbacks (MAE) before a target is reached.
Objective profit-taking zones based on actual market volatility rather than fixed point values.
Disclaimer: This tool is for educational and analytical purposes only and does not constitute financial advice.
Phát hành các Ghi chú
Updatet little dashboard Phát hành các Ghi chú
Dayli range in dashboardPhát hành các Ghi chú
Visuals updatetPhát hành các Ghi chú
Dashboard updated with live statisticsPhát hành các Ghi chú
name updatetPhát hành các Ghi chú
Updatet dashboardPhát hành các Ghi chú
dashboard updateMã nguồn mở
Theo đúng tinh thần TradingView, tác giả của tập lệnh này đã công bố nó dưới dạng mã nguồn mở, để các nhà giao dịch có thể xem xét và xác minh chức năng. Chúc mừng tác giả! Mặc dù bạn có thể sử dụng miễn phí, hãy nhớ rằng việc công bố lại mã phải tuân theo Nội quy.

Order-flow and session tooling for BTC — swiftedge.uk/depth
Thông báo miễn trừ trách nhiệm
Thông tin và các ấn phẩm này không nhằm mục đích, và không cấu thành, lời khuyên hoặc khuyến nghị về tài chính, đầu tư, giao dịch hay các loại khác do TradingView cung cấp hoặc xác nhận. Đọc thêm tại Điều khoản Sử dụng.
Mã nguồn mở
Theo đúng tinh thần TradingView, tác giả của tập lệnh này đã công bố nó dưới dạng mã nguồn mở, để các nhà giao dịch có thể xem xét và xác minh chức năng. Chúc mừng tác giả! Mặc dù bạn có thể sử dụng miễn phí, hãy nhớ rằng việc công bố lại mã phải tuân theo Nội quy.
Order-flow and session tooling for BTC — swiftedge.uk/depth
Thông báo miễn trừ trách nhiệm
Thông tin và các ấn phẩm này không nhằm mục đích, và không cấu thành, lời khuyên hoặc khuyến nghị về tài chính, đầu tư, giao dịch hay các loại khác do TradingView cung cấp hoặc xác nhận. Đọc thêm tại Điều khoản Sử dụng.