ICT Equal Highs & Lows (EQH/EQL) Liquidity Pools
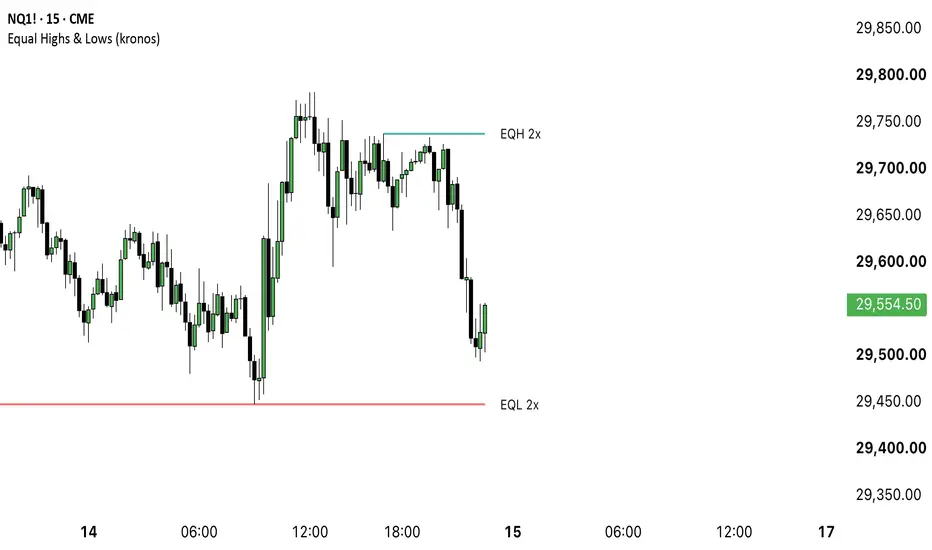
ICT Equal Highs & Lows (EQH/EQL) Liquidity Pools
What it does
This indicator marks the horizontal shelves that form when two or more confirmed swing highs, or swing lows, come to rest at almost the same price. Those shelves are where resting orders accumulate, and the script answers one question about each of them: is this shelf still untouched, has price wicked through it, or has price closed beyond it? Lines are drawn only where the swing anchors themselves are visible on the chart, so you can always see why a line sits where it sits.
How it works
Every swing point starts an invisible hypothesis: a shelf at that price, with a tolerance band around it. The hypothesis has to survive. If price leaves the band before a second qualifying swing arrives, the hypothesis is dead and a later similar price cannot bring it back. Only a hypothesis that survives long enough to collect the required number of swings becomes a visible pool.
How to use it
Inputs
Signals and alerts
All six fire on the close of the bar that produced the change. A shelf that the replay finds already taken raises no formation alert, because it was never visible as untouched.
Repainting
State changes only on a closed bar. On the live bar no shelf is added, removed or reclassified, so what you see on history is what you would have seen in real time. One thing does follow the live bar, and it rewrites nothing: the right edge of an untouched line. A second follows it only if you switch on Highlight nearest untapped pools - which line is marked as the nearest one ahead of price. Swing points are confirmed pivots and are therefore known a fixed number of bars after they happened; the script does not pretend otherwise, and it replays every bar since the shelf's first anchor, so a shelf cannot appear untouched at a price that was already traded through. Once a pool is visible its level and boundary are never rewritten.
Limitations
This script is a charting tool for educational purposes. It does not provide financial advice and does not predict future price movement. Trading carries risk; decisions and their outcome remain yours.
What it does
This indicator marks the horizontal shelves that form when two or more confirmed swing highs, or swing lows, come to rest at almost the same price. Those shelves are where resting orders accumulate, and the script answers one question about each of them: is this shelf still untouched, has price wicked through it, or has price closed beyond it? Lines are drawn only where the swing anchors themselves are visible on the chart, so you can always see why a line sits where it sits.
How it works
Every swing point starts an invisible hypothesis: a shelf at that price, with a tolerance band around it. The hypothesis has to survive. If price leaves the band before a second qualifying swing arrives, the hypothesis is dead and a later similar price cannot bring it back. Only a hypothesis that survives long enough to collect the required number of swings becomes a visible pool.
- Swing points are confirmed pivots, found from wicks or from candle bodies. A takeout is always measured on the wick, whichever mode you pick: price trading through the shelf is what takes it, however the swings themselves were found.
- The tolerance is frozen with the volatility of the swing that started the shelf. A later change in volatility can never pair two old swings after the fact.
- When a shelf is confirmed, every bar since its first anchor is replayed against it, oldest first. The first bar that went past its boundary decides both what happened and when, so a shelf that was already taken never appears as untouched.
- Once a pool becomes visible, its level and its boundary are fixed. Further swings at the same price raise the counter on the label and nothing else.
- The visible line sits on the extreme of the price group that confirmed it - the highest of the equal highs, the lowest of the equal lows, or the outermost body edge if you switched the swing source to Bodies - so it lies on a price that was actually traded and touches the structure it names. The boundary that decides a takeout sits past the outermost wick of that group, plus a buffer - a poke inside the band the shelf was defined with is noise rather than a takeout. That wick is first capped at the edge of the tolerance band, so a single oversized wick on the first swing cannot lift the boundary off the chart. Measuring the boundary from wicks matters under Bodies: a level is a body edge there, and the same bar's wick reaches past it, so a shelf would otherwise be taken by the very bar that confirmed it.
- A wick beyond the boundary marks the pool as swept. A close beyond it marks the pool as broken.
How to use it
- Add the script to a chart. It works on any symbol and any timeframe and reads only the bars of the chart you are on.
- With the default line style, read the solid lines as untouched shelves and the dashed ones as shelves price has already taken. Pick another style and the untouched ones follow it; a shelf that has been taken always draws dashed. Switch on Highlight nearest untapped pools if you also want the closest untouched shelf on each side drawn one step thicker.
- Check the anchors. Every line should start at a swing you can point at, and the price of that swing should sit within the tolerance you configured.
- If the chart shows more lines than you can read, lower the tolerance or raise the minimum number of equal highs and lows before touching the retention cap.
Inputs
- Swing length - bars required on each side of a swing point. Larger values give fewer and more significant shelves. Range 1-50, default 5.
- Measure swings from - Wicks uses the high and low, Bodies uses the open and close and ignores single long wicks.
- History searched - how long an unconfirmed hypothesis may wait for its second swing, and how far back a newly confirmed shelf is checked. Range 50-500, default 500.
- Tolerance unit - ATR multiple, ticks, or percent of price.
- Tolerance - how far apart two swings may sit and still count as equal. Default 0.10, which on a volatile index future works out around ten ticks.
- ATR length - length of the volatility measure, used by the ATR mode only. Range 1-200, default 14.
- Minimum equal highs/lows per pool - swings needed before a shelf becomes visible. Range 2-10, default 2.
- Takeout buffer - distance beyond the edge of the shelf that price must exceed before the pool counts as taken, in units of the frozen tolerance. Range 0-3, default 0.25, which is small enough that a stop run of a few ticks registers.
- Display group - show or hide each side, keep or drop swept and broken pools, retention cap per side, line width, line transparency, line style, labels and label size. Broken pools are dropped by default, so switch that on if you want all three states on the chart.
- Show EQH/EQL text and Show number of equal highs/lows - the label reads EQH 3x with both on, which is the default. Either can be switched off on its own.
- Line style - solid, dashed or dotted for the intact shelves. A shelf that has been taken always draws dashed, because that is its state and not a preference.
- Label background - off by default, so only the label text shows. Turn it on where a label sits over the candles and the bare text is hard to read.
- Highlight nearest untapped pools - draws the nearest untouched shelf on each side one step thicker. Off by default: a line that is thicker for a reason the chart does not explain is harder to read, not easier.
- Colors group - one colour each for buyside, sellside, swept and broken pools.
Signals and alerts
- Buyside pool formed and Sellside pool formed - fire when a shelf becomes visible and is still untouched.
- Buyside pool swept and Sellside pool swept - fire when a wick crosses the boundary and the bar closes back inside.
- Buyside pool broken and Sellside pool broken - fire when a bar closes beyond the boundary.
All six fire on the close of the bar that produced the change. A shelf that the replay finds already taken raises no formation alert, because it was never visible as untouched.
Repainting
State changes only on a closed bar. On the live bar no shelf is added, removed or reclassified, so what you see on history is what you would have seen in real time. One thing does follow the live bar, and it rewrites nothing: the right edge of an untouched line. A second follows it only if you switch on Highlight nearest untapped pools - which line is marked as the nearest one ahead of price. Swing points are confirmed pivots and are therefore known a fixed number of bars after they happened; the script does not pretend otherwise, and it replays every bar since the shelf's first anchor, so a shelf cannot appear untouched at a price that was already traded through. Once a pool is visible its level and boundary are never rewritten.
Limitations
- The very first swing of a shelf is the one bar never replayed against the shelf itself - it cannot be, or under Bodies a long wick on that bar would invalidate its own shelf before it exists. Under Bodies a small share of shelves therefore start on a bar whose wick already reached past the boundary. The cap on the boundary keeps that bounded; under Wicks it cannot happen at all.
- A swing is confirmed only after the configured number of bars have passed, so a shelf always becomes visible later than it formed. That delay is inherent to pivots and cannot be removed without looking ahead.
- On very quiet or thinly traded symbols the tolerance can be wide relative to the actual range, which pairs swings a trader would not group together. Lower it or switch to the tick mode.
- The script reads only the bars of the chart timeframe. It does not look at higher timeframes, at intrabar data, or at volume.
- It describes shelves that exist and what happened to them. It does not rank them, score them, or suggest entries, exits or targets.
- Shelves are dropped once the retention cap per side is exceeded. Taken shelves go first; a shelf that still holds is only dropped when no taken one is left, and then the oldest goes. Deep history is not kept on the chart.
- A shelf can be taken before its second swing exists. It is then drawn from its first anchor to the takeout and marked as taken, which puts the second swing to the right of where the line ends while the touch count still includes it.
- Swing points must stand out from the bars around them. Two highs at the same price no further apart than the swing length cancel each other out, so a tight double top can go unmarked. Lower the swing length if you want those.
This script is a charting tool for educational purposes. It does not provide financial advice and does not predict future price movement. Trading carries risk; decisions and their outcome remain yours.

Find my advanced premium indicators:
kronosindicators.com
kronosindicators.com
Thông báo miễn trừ trách nhiệm
Thông tin và các ấn phẩm này không nhằm mục đích, và không cấu thành, lời khuyên hoặc khuyến nghị về tài chính, đầu tư, giao dịch hay các loại khác do TradingView cung cấp hoặc xác nhận. Đọc thêm tại Điều khoản Sử dụng.
Find my advanced premium indicators:
kronosindicators.com
kronosindicators.com
Thông báo miễn trừ trách nhiệm
Thông tin và các ấn phẩm này không nhằm mục đích, và không cấu thành, lời khuyên hoặc khuyến nghị về tài chính, đầu tư, giao dịch hay các loại khác do TradingView cung cấp hoặc xác nhận. Đọc thêm tại Điều khoản Sử dụng.