OPEN-SOURCE SCRIPT
Cập nhật Global vs China Liquidity Proxy
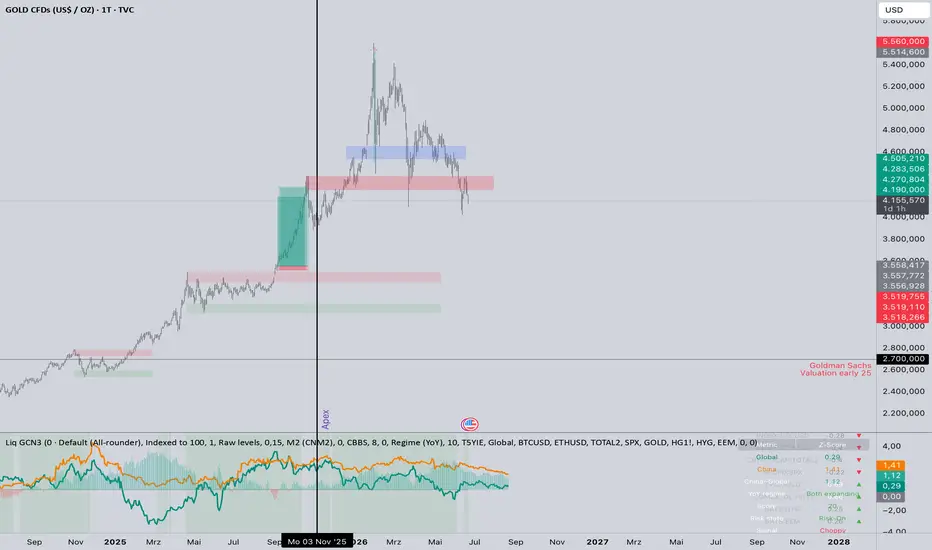
Global vs China Liquidity Proxy
One-line summary: Two central-bank liquidity composites — Global and China — plotted on a common normalized scale, with a divergence histogram, expansion/contraction regime shading, a configurable lead, and a live correlation to whatever asset the chart is on.
What it does
This indicator builds two macro-liquidity composites from central-bank balance sheets and financial-conditions data, then puts them on a shared, comparable scale so you can read global liquidity, China liquidity, and — most importantly — the gap between them at a glance.
Global composite — the four largest central-bank balance sheets converted to USD (Fed + BoJ/USDJPY + PBoC/USDCNY + ECB/USDEUR), modulated by a risk/financial-conditions block (China 10Y yield, the dollar index, and the US high-yield credit spread).
China composite — a Chinese liquidity stock (M2 by default, switchable to M1 or the PBoC balance sheet) modulated by China-native conditions: the 10Y yield, USD/CNY, and the interbank funding rate. China liquidity is largely a commercial-bank credit-creation story, which is why M2 — not the central-bank balance sheet — is the default base.
Because the two raw composites differ by orders of magnitude, they are always shown through a normalization transform so they can be compared directly.
Why YoY and Z-Score matter
In level terms, both composites are dominated by the relentless growth of central-bank balance sheets, and the risk modulators barely register. The growth rate (YoY) and the rolling Z-Score are where the financial-conditions signal actually shows up, and where the two regions become genuinely comparable. The level/indexed view is best read as a pure liquidity-stock line; YoY and Z-Score are the analytical views.
Inputs
Display transform
Indexed to 100 — both lines = 100 at an anchor date; reads relative divergence since that date.
YoY % — true 12-calendar-month change (computed from a monthly buffer, so it reads identically on Daily, Weekly, or Monthly).
Z-Score — rolling standardized score; detrends the series into an oscillator and is base-date-independent.
Raw — unprocessed composites (scales differ; for debugging a single line only).
Modulator mode
Raw levels — modulators applied as direct multiplicative factors.
Z-scored — modulators applied as exp(−k · tightness), where tightness is the combined Z-Score of the conditions block, so they meaningfully move the line. The k sensitivity controls the strength.
China liquidity base — M2 (broad, bank-credit-driven; default), M1 (the activity/impulse gauge), or the PBoC balance sheet (central-bank only).
Overlays & lead
China − Global divergence histogram — green when China is leading the global cycle, red when lagging.
YoY regime shading — green background when both composites' YoY > 0 (joint expansion), red when both < 0 (joint contraction), clear when they disagree.
Lead / offset (months) — shifts the proxies forward to align their known lead over risk assets, and lags them by the same amount inside the correlation calculation.
Correlation — rolling correlation of each composite to the chart's asset, computed YoY-vs-YoY (growth rate against growth rate) to avoid the spurious correlation you get from comparing two trending levels. Shown live in the table and optionally plotted.
How to use it
Run it on Daily, Weekly, or Monthly — the underlying economic series update monthly.
Watch the divergence histogram for China leading or lagging the global liquidity cycle. A flip to red while the regime stays green (global still expanding, China rolling over) is the classic setup where China-beta assets begin to underperform before the broad tape reacts.
Use the correlation cell to confirm whether the asset on your chart is actually tracking liquidity right now, and which region it tracks more closely.
Use the lead/offset to align the proxy's turning points with later price turns, since liquidity typically leads risk assets by a couple of months.
Alerts
China YoY zero-cross (up/down), Global YoY zero-cross (up/down), divergence sign-flip (China leading / lagging), and regime change (both expanding / both contracting).
Notes
Some component symbols may require a higher TradingView data plan; substitute or remove any that don't load in your account.
Readings stabilize once roughly 13+ months of history are loaded.
This is a macro context and research tool, not a signal generator, and nothing here is financial advice.
One-line summary: Two central-bank liquidity composites — Global and China — plotted on a common normalized scale, with a divergence histogram, expansion/contraction regime shading, a configurable lead, and a live correlation to whatever asset the chart is on.
What it does
This indicator builds two macro-liquidity composites from central-bank balance sheets and financial-conditions data, then puts them on a shared, comparable scale so you can read global liquidity, China liquidity, and — most importantly — the gap between them at a glance.
Global composite — the four largest central-bank balance sheets converted to USD (Fed + BoJ/USDJPY + PBoC/USDCNY + ECB/USDEUR), modulated by a risk/financial-conditions block (China 10Y yield, the dollar index, and the US high-yield credit spread).
China composite — a Chinese liquidity stock (M2 by default, switchable to M1 or the PBoC balance sheet) modulated by China-native conditions: the 10Y yield, USD/CNY, and the interbank funding rate. China liquidity is largely a commercial-bank credit-creation story, which is why M2 — not the central-bank balance sheet — is the default base.
Because the two raw composites differ by orders of magnitude, they are always shown through a normalization transform so they can be compared directly.
Why YoY and Z-Score matter
In level terms, both composites are dominated by the relentless growth of central-bank balance sheets, and the risk modulators barely register. The growth rate (YoY) and the rolling Z-Score are where the financial-conditions signal actually shows up, and where the two regions become genuinely comparable. The level/indexed view is best read as a pure liquidity-stock line; YoY and Z-Score are the analytical views.
Inputs
Display transform
Indexed to 100 — both lines = 100 at an anchor date; reads relative divergence since that date.
YoY % — true 12-calendar-month change (computed from a monthly buffer, so it reads identically on Daily, Weekly, or Monthly).
Z-Score — rolling standardized score; detrends the series into an oscillator and is base-date-independent.
Raw — unprocessed composites (scales differ; for debugging a single line only).
Modulator mode
Raw levels — modulators applied as direct multiplicative factors.
Z-scored — modulators applied as exp(−k · tightness), where tightness is the combined Z-Score of the conditions block, so they meaningfully move the line. The k sensitivity controls the strength.
China liquidity base — M2 (broad, bank-credit-driven; default), M1 (the activity/impulse gauge), or the PBoC balance sheet (central-bank only).
Overlays & lead
China − Global divergence histogram — green when China is leading the global cycle, red when lagging.
YoY regime shading — green background when both composites' YoY > 0 (joint expansion), red when both < 0 (joint contraction), clear when they disagree.
Lead / offset (months) — shifts the proxies forward to align their known lead over risk assets, and lags them by the same amount inside the correlation calculation.
Correlation — rolling correlation of each composite to the chart's asset, computed YoY-vs-YoY (growth rate against growth rate) to avoid the spurious correlation you get from comparing two trending levels. Shown live in the table and optionally plotted.
How to use it
Run it on Daily, Weekly, or Monthly — the underlying economic series update monthly.
Watch the divergence histogram for China leading or lagging the global liquidity cycle. A flip to red while the regime stays green (global still expanding, China rolling over) is the classic setup where China-beta assets begin to underperform before the broad tape reacts.
Use the correlation cell to confirm whether the asset on your chart is actually tracking liquidity right now, and which region it tracks more closely.
Use the lead/offset to align the proxy's turning points with later price turns, since liquidity typically leads risk assets by a couple of months.
Alerts
China YoY zero-cross (up/down), Global YoY zero-cross (up/down), divergence sign-flip (China leading / lagging), and regime change (both expanding / both contracting).
Notes
Some component symbols may require a higher TradingView data plan; substitute or remove any that don't load in your account.
Readings stabilize once roughly 13+ months of history are loaded.
This is a macro context and research tool, not a signal generator, and nothing here is financial advice.
Phát hành các Ghi chú
Global vs China Liquidity ProxyOne-line summary: Two central-bank liquidity composites — Global and China — plotted on a common normalized scale, with a divergence histogram, expansion/contraction regime shading, a configurable lead, a live correlation to whatever asset the chart is on, and one-click presets for each use case.
What it does
This indicator builds two macro-liquidity composites from central-bank balance sheets and financial-conditions data, then puts them on a shared, comparable scale so you can read global liquidity, China liquidity, and — most importantly — the gap between them at a glance.
Global composite — the four largest central-bank balance sheets converted to USD (Fed + BoJ/USDJPY + PBoC/USDCNY + ECB/USDEUR), modulated by a risk/financial-conditions block (China 10Y yield, the dollar index, and the US high-yield credit spread).
China composite — a Chinese liquidity stock (M2 by default, switchable to M1 or the PBoC balance sheet) modulated by China-native conditions: the 10Y yield, USD/CNY, and the interbank funding rate. China liquidity is largely a commercial-bank credit-creation story, which is why M2 — not the central-bank balance sheet — is the default base.
Because the two raw composites differ by orders of magnitude, they are always shown through a normalization transform so they can be compared directly.
Why YoY and Z-Score matter
In level terms, both composites are dominated by the relentless growth of central-bank balance sheets, and the risk modulators barely register. The growth rate (YoY) and the rolling Z-Score are where the financial-conditions signal actually shows up, and where the two regions become genuinely comparable. The level/indexed view is best read as a pure liquidity-stock line; YoY and Z-Score are the analytical views.
Presets
A single Preset dropdown applies a ready-made configuration for each use case. It sets the display transform, modulator mode and sensitivity, China base, lead, smoothing, divergence, regime shading, and correlation. The recommended timeframe is shown in the table (green = current timeframe matches, orange = mismatch), since a script cannot change the chart timeframe itself. Choose Custom to drive everything from the manual fields.
#PresetTransformModulatorChina baseLeadSmoothDivCorrRec. TF0Default (All-rounder)Z-ScoreZ-scored (k 0.20)M221ononWeekly1Macro Regime / Now-CastingYoY %Raw levelsM202ononWeekly/Monthly2Risk-Asset TimingZ-ScoreZ-scored (k 0.20)M221ononWeekly3China Decoupling / Early WarningZ-ScoreRaw levelsM101ononWeekly4Commodities / China Credit ImpulseYoY %Raw levelsM162ononWeekly/Monthly5Financial-Conditions StressZ-ScoreZ-scored (k 0.30)M211ononWeekly6Structural Long-Term ViewIndexed to 100Raw levelsM204offoffMonthly
Preset notes:
0 Default — balanced all-rounder; covers regime, timing, and asset relationship at once.
1 Macro Regime — "where are we in the cycle." Read the background shading: both YoY > 0 = tailwind.
2 Risk-Asset Timing — exploit the liquidity lead over BTC, crypto beta, and equities; watch the Z-Score turning up out of negative territory while correlation is high.
3 China Decoupling — M1 (fast impulse) plus the divergence histogram; histogram flipping red while the regime is still green is the early-warning that China beta underperforms soon.
4 Commodities — the China credit impulse leads commodities by roughly six months, hence the longer lead and M1 base.
5 Financial-Conditions Stress — modulators deliberately dominant (high k); spread spikes and dollar rallies visibly drag the line.
6 Structural — big-picture liquidity stock since an anchor date; monthly, heavy smoothing, overlays off.
Inputs
Display transform
Indexed to 100 — both lines = 100 at an anchor date; reads relative divergence since that date.
YoY % — true 12-calendar-month change (computed from a monthly buffer, so it reads identically on Daily, Weekly, or Monthly).
Z-Score — rolling standardized score; detrends the series into an oscillator and is base-date-independent.
Raw — unprocessed composites (scales differ; for debugging a single line only).
Modulator mode
Raw levels — modulators applied as direct multiplicative factors.
Z-scored — modulators applied as exp(−k · tightness), where tightness is the combined Z-Score of the conditions block, so they meaningfully move the line. The k sensitivity controls the strength.
China liquidity base — M2 (broad, bank-credit-driven; default), M1 (the activity/impulse gauge), or the PBoC balance sheet (central-bank only).
Overlays & lead
China − Global divergence histogram — green when China is leading the global cycle, red when lagging.
YoY regime shading — green background when both composites' YoY > 0 (joint expansion), red when both < 0 (joint contraction), clear when they disagree.
Lead / offset (months) — shifts the proxies forward to align their known lead over risk assets, and lags them by the same amount inside the correlation calculation.
Correlation — rolling correlation of each composite to the chart's asset, computed YoY-vs-YoY (growth rate against growth rate) to avoid the spurious correlation you get from comparing two trending levels. Shown live in the table and optionally plotted.
How to use it
Run it on Daily, Weekly, or Monthly — the underlying economic series update monthly.
Pick a Preset to match your question, then set the chart to the recommended timeframe (the table tells you if it matches).
Watch the divergence histogram for China leading or lagging the global liquidity cycle. A flip to red while the regime stays green (global still expanding, China rolling over) is the classic setup where China-beta assets begin to underperform before the broad tape reacts.
Use the correlation cell to confirm whether the asset on your chart is actually tracking liquidity right now, and which region it tracks more closely.
Use the lead/offset to align the proxy's turning points with later price turns, since liquidity typically leads risk assets by a couple of months.
Alerts
China YoY zero-cross (up/down), Global YoY zero-cross (up/down), divergence sign-flip (China leading / lagging), and regime change (both expanding / both contracting).
Notes
Some component symbols may require a higher TradingView data plan; substitute or remove any that don't load in your account.
Readings stabilize once roughly 13+ months of history are loaded.
This is a macro context and research tool, not a signal generator, and nothing here is financial advice.
Phát hành các Ghi chú
Global vs China Liquidity ProxyTwo central-bank liquidity composites — Global and China — on a shared normalized scale, with a divergence histogram, expansion/contraction regime shading, a configurable lead, a live correlation to the chart's asset, ready-made presets, and alerts.
Overview
This indicator builds two macro-liquidity composites from central-bank balance sheets and financial-conditions data, then puts them on a common, comparable scale so you can read global liquidity, China liquidity, and — most usefully — the gap between them at a glance.
Global = the four largest central-bank balance sheets in USD (Fed + BoJ + PBoC + ECB), modulated by a risk/conditions block (China 10Y yield, the dollar index, US high-yield credit spread).
China = a Chinese liquidity stock (M2 by default; switchable to M1 or the PBoC balance sheet), modulated by China-native conditions (10Y yield, USD/CNY, interbank funding rate).
Because the raw composites differ in magnitude by orders of magnitude, they are always shown through a normalization transform.
How it works (methodology)
1. Liquidity stocks — balance sheets converted to a common USD base:
stockG = USCBBS + JPNASSETS/USDJPY + CNCBBS/USDCNY + ECBASSETSW/USDEUR
cnStock = CNM2 (or CNM1, or CNCBBS)
2. Composite — two modulator modes.
Raw levels (the original spread expression):
globalLiq = CN10Y / DXY / HY_spread * stockG
chinaLiq = CN10Y / USDCNY / interbank_rate * cnStock
Z-scored — each modulator is standardized over the Z-Score lookback, combined into a "tightness" index (higher = tighter), and applied as a multiplicative factor centered on 1:
z(x) = ( x − SMA(x, zLen) ) / StdDev(x, zLen)
zTightG = z(DXY) + z(HY_spread) − z(CN10Y)
zTightC = z(USDCNY) + z(interbank) − z(CN10Y)
globalLiq = stockG * exp( −k · zTightG )
chinaLiq = cnStock * exp( −k · zTightC )
At average conditions (zTight = 0) the factor is exactly 1, so the composite equals the pure stock; tighter conditions scale it down, looser conditions scale it up. k controls the strength.
3. True 12-month YoY — computed from a calendar-month buffer (not a bar count), so it reads identically on Daily, Weekly, or Monthly:
YoY(t) = ( composite(t) − composite(t−12m) ) / composite(t−12m) * 100
4. Display transform (then smoothed by an SMA):
Indexed to 100 — composite / base * 100, base = composite at the anchor date.
YoY % — the true 12-month change above.
Z-Score — rolling standardized score; detrends the (always-rising) balance sheets into an oscillator and is base-date-independent.
Raw — the unprocessed composite (scales differ; debugging a single line only).
5. Derived series:
divergence = cDisp − gDisp (+ = China leading)
regime = up if (gYoY>0 and cYoY>0), down if both <0
lead = proxies shifted forward N months
correlation= corr( assetYoY, proxyYoY[lead], corrLen ) per region
Correlation runs YoY vs YoY (growth rate against growth rate) rather than level vs price, to avoid the spurious correlation produced by two co-trending levels.
Presets
A Preset dropdown applies ready-made settings per use case; the script drives the effective parameters directly. Choose Custom to use the manual fields. The recommended timeframe is shown in the table (green = current timeframe matches, orange = mismatch), since a script cannot change the chart's resolution itself.
PresetTransformModulatorsChina baseLeadSmoothDivergenceCorrelationRec. timeframe0 · Default (All-rounder)Z-ScoreZ-scored (k 0.20)M221ononWeekly1 · Macro Regime / Now-CastingYoY %Raw levelsM202ononWeekly/Monthly2 · Risk-Asset TimingZ-ScoreZ-scored (k 0.20)M221ononWeekly3 · China Decoupling / Early WarningZ-ScoreRaw levelsM101ononWeekly4 · Commodities / China Credit ImpulseYoY %Raw levelsM162ononWeekly/Monthly5 · Financial-Conditions StressZ-ScoreZ-scored (k 0.30)M211ononWeekly6 · Structural / Long-TermIndexed to 100Raw levelsM204offoffMonthly
M2 is the broad, bank-credit-driven base for structural and regime reads; M1 is the faster impulse gauge used for early-warning and the China-led commodity cycle (hence presets 3 and 4 use M1, and preset 4 uses a longer 6-month lead). Preset 5 raises modulator sensitivity so credit spreads, the dollar, and funding stress visibly move the line. Index anchor, lookback lengths, show toggles, and the correlation plot stay manual at all times.
Inputs
Preset — applies a full configuration; "Custom" uses the manual fields below.
Display transform — Indexed to 100 / YoY % / Z-Score / Raw.
Modulator mode + k — Raw levels (original) vs Z-scored (modulators actually bite).
China liquidity base — M2 / M1 / PBoC balance sheet.
Overlays & lead — divergence histogram, regime shading, lead/offset in months.
Correlation — on/off, optional separate plot, length.
Lookbacks — correlation length and Z-Score length (0 = auto by timeframe).
Index anchor date — for the Indexed-to-100 mode.
How to use it
Run it on Daily, Weekly, or Monthly — the underlying economic series update monthly.
Watch the divergence histogram for China leading or lagging the global cycle. A flip to red while the regime stays green (global still expanding, China rolling over) is the classic setup where China-beta assets begin to underperform before the broad tape reacts.
Use the correlation cell to confirm whether the asset on your chart is currently tracking liquidity at all, and which region it tracks more closely.
Use the lead/offset to align the proxy's turns with later price turns, since liquidity typically leads risk assets by a couple of months.
Alerts
China YoY zero-cross (up/down), Global YoY zero-cross (up/down), divergence sign-flip (China leading / lagging), and regime change (both expanding / both contracting).
Notes & limitations
Modulators are near-inert in level/indexed mode. In Raw-levels mode the front-end modulators are small factors in front of a balance-sheet sum that dwarfs them; they only meaningfully move the line in Z-scored mode or in the YoY / Z-Score views. Treat the indexed/level view as a near-pure liquidity-stock line.
FX appears twice by construction. DXY (global) and USD/CNY (China) sit in both the USD conversion of the stock and the modulator block — a mild double-count that is inherited from the original spread expression and left intentional.
Some component symbols may require a higher TradingView data plan; substitute or remove any that don't load in your account.
Readings stabilize once roughly 13+ months of history are loaded.
This is a macro context and research tool, not a signal generator, and nothing here is financial advice.
Phát hành các Ghi chú
Global vs China Liquidity Proxy (v3)Two central-bank liquidity composites — Global and China — on a shared normalized scale, extended with net-liquidity sourcing, a liquidity-beta scanner, a composite risk score, a signal-quality filter, a GRID regime cell, presets, and alerts.
Overview
The indicator builds two macro-liquidity composites from central-bank balance sheets and financial-conditions data and puts them on a common, comparable scale, so you can read global liquidity, China liquidity, and the gap between them at a glance. v3 adds six modules that turn it from a two-line chart into a small macro cockpit.
Global = the major central-bank balance sheets in USD (Fed + BoJ + PBoC + ECB), modulated by a risk block (China 10Y, dollar index, US high-yield spread).
China = a Chinese liquidity stock (M2 / M1 / PBoC), modulated by China-native conditions (10Y, USD/CNY, interbank rate).
Raw composites differ in magnitude, so they are always shown through a normalization transform (Indexed / YoY / Z-Score / Raw).
Core methodology
stockG = US leg + BoJ/USDJPY + PBoC/USDCNY + ECB/USDEUR
cnStock = CNM2 | CNM1 | CNCBBS
Raw mode : globalLiq = CN10Y/DXY/HY * stockG ; chinaLiq = CN10Y/USDCNY/interbank * cnStock
Z-scored : globalLiq = stockG * exp(−k·[z(DXY)+z(HY)−z(CN10Y)])
chinaLiq = cnStock * exp(−k·[z(USDCNY)+z(interbank)−z(CN10Y)])
YoY(t) = (composite − composite 12 months ago) / … * 100 (calendar-month based)
display = Indexed to 100 | YoY % | Z-Score | Raw, then optional HMA / SMA smoothing
Correlation to the chart asset is computed YoY vs YoY (growth rate vs growth rate) to avoid spurious trend correlation.
Extension modules (each independently toggleable)
1 · Liquidity sources — choose the global stock source: central-bank balance sheets (default), broad money (M2), or their average. A Net liquidity toggle replaces the US leg with WALCL − TGA − RRP (Fed net liquidity), the measure that most directly drives risk assets.
2 · Liquidity-beta scanner — a table of up to eight assets (BTC, ETH, TOTAL2, SPX, Gold, Copper, HYG, EEM by default, all editable). For each it shows the correlation of the asset's YoY to the chosen reference proxy (Global or China) and an implied direction (correlation sign × current liquidity-momentum direction), with an optional risk-adjusted Sharpe~ column. Use it to see which assets are most liquidity-sensitive right now and which way liquidity is pushing them.
3 · Composite score & risk — an equal-weighted, standardized liquidity-momentum score (−100…+100) from global Z, China Z, and inverted-dollar Z, with a Risk-On / Risk-Off state. Selectable background mode (Regime / Risk-On-Off / None), optional score line, and optional chart bar coloring by risk state.
4 · Signal quality — a Kaufman Efficiency Ratio on the global composite classifies the liquidity series as Trending / Transitional / Choppy, telling you when the lead and divergence signals are reliable versus noise. (This is a Pine-practical stand-in for heavier stationarity tests.)
5 · GRID regime — a Goldilocks / Reflation / Inflation / Deflation cell from a growth axis (global liquidity YoY) and an inflation axis (a configurable inflation proxy, default 5y breakevens), mapping liquidity into the 42MACRO-style quadrants.
6 · Speed & format — optional HMA smoothing for faster turns, double-normalization for crypto, a divergence noise threshold (small values greyed as noise), and a multi-horizon RoC row (3 / 6 / 12-month) for reading acceleration.
Presets
A Preset dropdown sets the core view; Custom uses the manual fields. The recommended timeframe is shown in the table (green = matches, orange = mismatch). The extension modules above have their own toggles and are not preset-controlled.
PresetTransformModulatorsChina baseLeadSmoothRec. timeframe0 · Default (All-rounder)Z-ScoreZ-scored (k 0.20)M221Weekly1 · Macro Regime / Now-CastingYoY %Raw levelsM202Weekly/Monthly2 · Risk-Asset TimingZ-ScoreZ-scored (k 0.20)M221Weekly3 · China Decoupling / Early WarningZ-ScoreRaw levelsM101Weekly4 · Commodities / China Credit ImpulseYoY %Raw levelsM162Weekly/Monthly5 · Financial-Conditions StressZ-ScoreZ-scored (k 0.30)M211Weekly6 · Structural / Long-TermIndexed to 100Raw levelsM204Monthly
Alerts
China / Global YoY zero-cross (up/down), divergence sign-flip, composite score zero-cross (Risk-On / Risk-Off), and regime change (both expanding / both contracting).
How to use it
Run on Daily, Weekly, or Monthly — the underlying economic series update monthly.
Read the score and background for the overall liquidity tailwind/headwind, the divergence histogram for China leading or lagging, the scanner for which assets are most liquidity-sensitive and their implied direction, and the signal cell to gauge whether the current reading is trend or noise.
Notes & limitations
Modulators are near-inert in level/indexed mode and only meaningfully move the line in Z-scored mode or the YoY / Z-Score views.
FX appears twice by construction (DXY / USD-CNY in both the USD conversion and the modulator block) — inherited from the original spread and left intentional.
Net liquidity uses FRED units (WALCL in millions, TGA/RRP scaled from billions); if the US leg looks mis-scaled, that conversion is the place to check.
The indicator uses many request.security symbols; some may require a higher TradingView data plan — substitute or remove any that don't load.
Readings stabilize once roughly 13+ months of history are loaded.
This is a macro research tool, not a signal generator, and nothing here is financial advice.
Mã nguồn mở
Theo đúng tinh thần TradingView, tác giả của tập lệnh này đã công bố nó dưới dạng mã nguồn mở, để các nhà giao dịch có thể xem xét và xác minh chức năng. Chúc mừng tác giả! Mặc dù bạn có thể sử dụng miễn phí, hãy nhớ rằng việc công bố lại mã phải tuân theo Nội quy.

Thông báo miễn trừ trách nhiệm
Thông tin và các ấn phẩm này không nhằm mục đích, và không cấu thành, lời khuyên hoặc khuyến nghị về tài chính, đầu tư, giao dịch hay các loại khác do TradingView cung cấp hoặc xác nhận. Đọc thêm tại Điều khoản Sử dụng.
Mã nguồn mở
Theo đúng tinh thần TradingView, tác giả của tập lệnh này đã công bố nó dưới dạng mã nguồn mở, để các nhà giao dịch có thể xem xét và xác minh chức năng. Chúc mừng tác giả! Mặc dù bạn có thể sử dụng miễn phí, hãy nhớ rằng việc công bố lại mã phải tuân theo Nội quy.
Thông báo miễn trừ trách nhiệm
Thông tin và các ấn phẩm này không nhằm mục đích, và không cấu thành, lời khuyên hoặc khuyến nghị về tài chính, đầu tư, giao dịch hay các loại khác do TradingView cung cấp hoặc xác nhận. Đọc thêm tại Điều khoản Sử dụng.