DXY Regime & Bitcoin Cycle Indicator
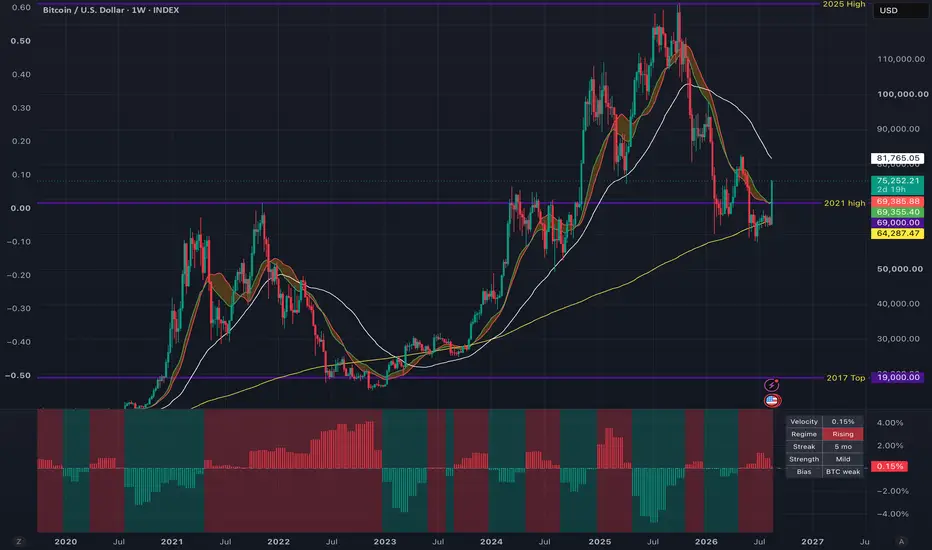
DXY Regime & Bitcoin Cycle Indicator
This indicator measures the current U.S. Dollar (DXY) trend regime and its historical relationship with Bitcoin performance.
Core Idea
Bitcoin has spent most of its existence inside a long-term dollar bull market. Historically, Bitcoin’s strongest returns have occurred during periods of dollar weakness. This tool identifies whether the dollar is currently in a Falling or Rising regime using a simple but effective method.
Methodology
Uses monthly DXY data
What the Indicator Shows
How to Use
This is a macro regime filter, not a short-term timing tool.
It helps assess the broader dollar backdrop when making Bitcoin allocation or risk decisions. A Falling Dollar regime has historically provided a stronger tailwind for Bitcoin, while a Rising Dollar regime has often acted as a headwind.
Disclaimer: This script is for educational and research purposes only. It does not constitute financial advice.
This indicator measures the current U.S. Dollar (DXY) trend regime and its historical relationship with Bitcoin performance.
Core Idea
Bitcoin has spent most of its existence inside a long-term dollar bull market. Historically, Bitcoin’s strongest returns have occurred during periods of dollar weakness. This tool identifies whether the dollar is currently in a Falling or Rising regime using a simple but effective method.
Methodology
Uses monthly DXY data
- Calculates a 4-month Simple Moving Average of DXY
- Measures the 2-month Rate of Change of that SMA (called Dollar Trend Velocity)
- Negative velocity = Falling Dollar Regime (historically more favorable for Bitcoin)
- Positive velocity = Rising Dollar Regime (historically less favorable for Bitcoin)
What the Indicator Shows
- Background coloring: Teal = Falling regime | Red = Rising regime
- Histogram: Dollar Trend Velocity
- Table (top right):
- Velocity
- Regime (Falling / Rising)
- Streak (consecutive months in current regime)
- Strength (Mild / Moderate / Strong)
- Bias (BTC bullish / BTC weak)
How to Use
This is a macro regime filter, not a short-term timing tool.
It helps assess the broader dollar backdrop when making Bitcoin allocation or risk decisions. A Falling Dollar regime has historically provided a stronger tailwind for Bitcoin, while a Rising Dollar regime has often acted as a headwind.
Disclaimer: This script is for educational and research purposes only. It does not constitute financial advice.

Thông báo miễn trừ trách nhiệm
Thông tin và các ấn phẩm này không nhằm mục đích, và không cấu thành, lời khuyên hoặc khuyến nghị về tài chính, đầu tư, giao dịch hay các loại khác do TradingView cung cấp hoặc xác nhận. Đọc thêm tại Điều khoản Sử dụng.
Thông báo miễn trừ trách nhiệm
Thông tin và các ấn phẩm này không nhằm mục đích, và không cấu thành, lời khuyên hoặc khuyến nghị về tài chính, đầu tư, giao dịch hay các loại khác do TradingView cung cấp hoặc xác nhận. Đọc thêm tại Điều khoản Sử dụng.