OPEN-SOURCE SCRIPT
Long-Term Growth Stock Scorer
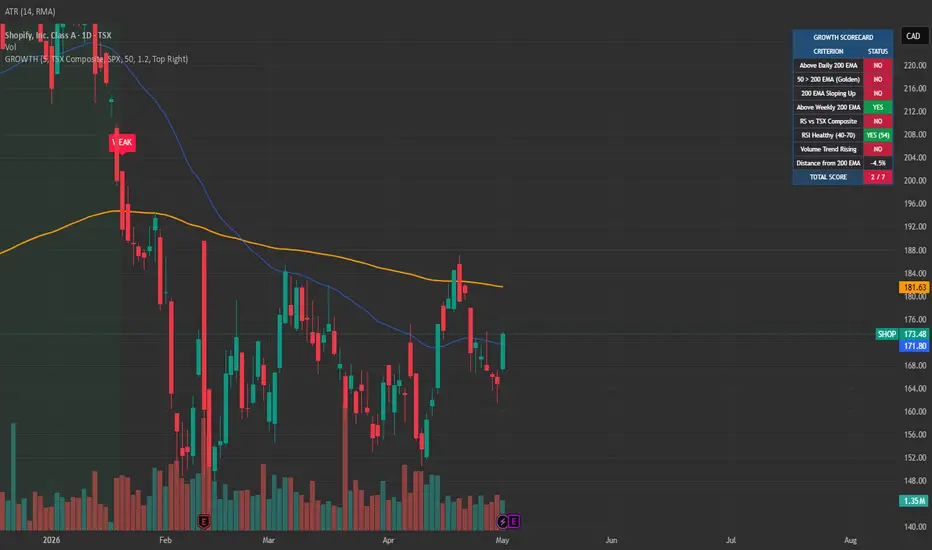
Long-Term Growth Stock Scorer plots a 7-criterion scoring system on any stock, identifying high-quality growth setups and signaling 200 EMA retest entries. Designed for long-term investors building positions in trending stocks with confirmed strength across trend, momentum, and participation.
THE 7-CRITERION SCORECARD
Each stock is scored 0-7 based on:
Price above daily 200 EMA — primary trend
50 EMA above 200 EMA — golden cross alignment
200 EMA sloping up — confirmed long-term uptrend
Price above weekly 200 EMA — multi-timeframe confirmation
Relative strength vs benchmark (S&P 500, NASDAQ 100, TSX Composite, FTSE, ASX, Russell 2000, or any custom symbol)
RSI in healthy range (40-70) — momentum quality, not exhausted
Volume trend rising — institutional participation expanding
SIGNALS
BUY label fires when a qualified stock (score >= threshold) retests its 200 EMA on volume
WEAK label fires when a held position drops below the qualification threshold
Background highlight when current score is in the qualified zone
Three built-in alerts: buy signal, score weakening, and score strengthening (entering the qualified zone)
FEATURES
Configurable benchmark index — works for any major market or custom symbol
Live dashboard showing each criterion's pass/fail status, current RSI value, and distance from 200 EMA
Six dashboard position options
Adjustable minimum score threshold (default 5/7)
Volume confirmation toggle for retest signals
HOW TO USE
Run on any stock chart on the daily timeframe. Set your benchmark to match the stock's market (S&P 500 for US stocks, TSX Composite for Canadian stocks, etc.). Use the dashboard to scan watchlist stocks for current qualification. When a qualified stock retests its 200 EMA on rising volume, the BUY signal fires.
Best used as a confirmation layer alongside fundamental analysis — strong technical setups need strong businesses underneath.
Open-source. Feedback and forks welcome.
THE 7-CRITERION SCORECARD
Each stock is scored 0-7 based on:
Price above daily 200 EMA — primary trend
50 EMA above 200 EMA — golden cross alignment
200 EMA sloping up — confirmed long-term uptrend
Price above weekly 200 EMA — multi-timeframe confirmation
Relative strength vs benchmark (S&P 500, NASDAQ 100, TSX Composite, FTSE, ASX, Russell 2000, or any custom symbol)
RSI in healthy range (40-70) — momentum quality, not exhausted
Volume trend rising — institutional participation expanding
SIGNALS
BUY label fires when a qualified stock (score >= threshold) retests its 200 EMA on volume
WEAK label fires when a held position drops below the qualification threshold
Background highlight when current score is in the qualified zone
Three built-in alerts: buy signal, score weakening, and score strengthening (entering the qualified zone)
FEATURES
Configurable benchmark index — works for any major market or custom symbol
Live dashboard showing each criterion's pass/fail status, current RSI value, and distance from 200 EMA
Six dashboard position options
Adjustable minimum score threshold (default 5/7)
Volume confirmation toggle for retest signals
HOW TO USE
Run on any stock chart on the daily timeframe. Set your benchmark to match the stock's market (S&P 500 for US stocks, TSX Composite for Canadian stocks, etc.). Use the dashboard to scan watchlist stocks for current qualification. When a qualified stock retests its 200 EMA on rising volume, the BUY signal fires.
Best used as a confirmation layer alongside fundamental analysis — strong technical setups need strong businesses underneath.
Open-source. Feedback and forks welcome.
Mã nguồn mở
Theo đúng tinh thần TradingView, tác giả của tập lệnh này đã công bố nó dưới dạng mã nguồn mở, để các nhà giao dịch có thể xem xét và xác minh chức năng. Chúc mừng tác giả! Mặc dù bạn có thể sử dụng miễn phí, hãy nhớ rằng việc công bố lại mã phải tuân theo Nội quy.

Thông báo miễn trừ trách nhiệm
Thông tin và các ấn phẩm này không nhằm mục đích, và không cấu thành, lời khuyên hoặc khuyến nghị về tài chính, đầu tư, giao dịch hay các loại khác do TradingView cung cấp hoặc xác nhận. Đọc thêm tại Điều khoản Sử dụng.
Mã nguồn mở
Theo đúng tinh thần TradingView, tác giả của tập lệnh này đã công bố nó dưới dạng mã nguồn mở, để các nhà giao dịch có thể xem xét và xác minh chức năng. Chúc mừng tác giả! Mặc dù bạn có thể sử dụng miễn phí, hãy nhớ rằng việc công bố lại mã phải tuân theo Nội quy.
Thông báo miễn trừ trách nhiệm
Thông tin và các ấn phẩm này không nhằm mục đích, và không cấu thành, lời khuyên hoặc khuyến nghị về tài chính, đầu tư, giao dịch hay các loại khác do TradingView cung cấp hoặc xác nhận. Đọc thêm tại Điều khoản Sử dụng.