SwiftEdge FVG Lifecycle
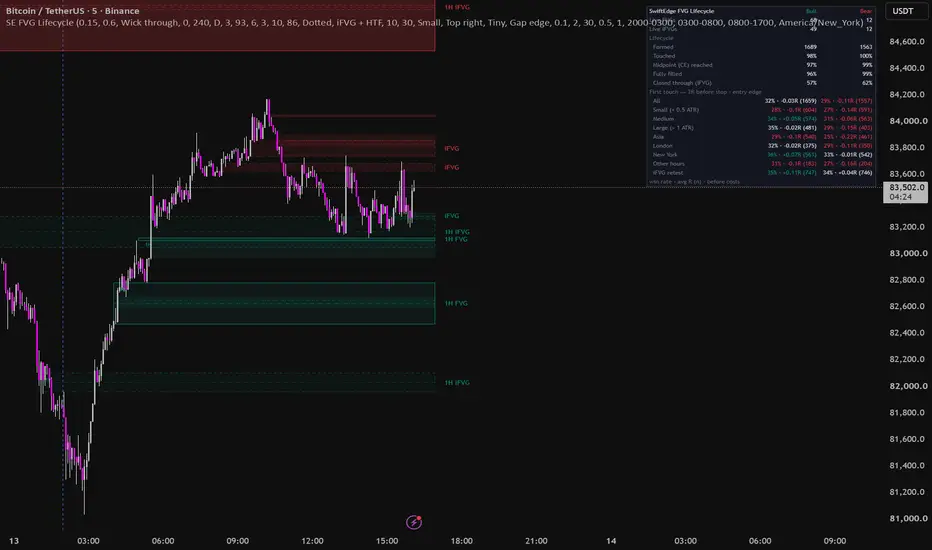
SwiftEdge FVG Lifecycle follows every fair value gap (FVG) through its whole life: untouched, tapped, midpoint (CE) reached, filled, or closed through and turned into an inverse FVG (iFVG). Only live gaps stay on the chart. The panel shows what happened to the gaps on your own symbol and timeframe: how many were touched, reached the midpoint, filled or inverted, and how a simple first-touch entry at the gap performed, split by gap size and session.
Most FVG tools only draw boxes. This one is built to answer which gaps are worth paying attention to.
WHAT IT SHOWS
• Fair value gaps
A bullish FVG forms when the low of candle 3 is above the high of candle 1, leaving a price range the middle candle moved through without overlap. A bearish FVG is the mirror image. Two filters remove weak gaps:
– Minimum size in ATR(14), so the same setting works on any symbol and timeframe.
– Displacement: the middle candle must close in the direction of the gap with a body of at least a chosen number of ATR (0 = off).
A strong move often leaves several overlapping gaps on consecutive candles. By default these are merged into one gap, because they are one imbalance created by one move.
• Lifecycle on the chart
– Untouched gaps are drawn with full shading. Tapped gaps are drawn lighter.
– With "Shrink to the unfilled part" on, the box shrinks as price trades into it, so you always see the part of the imbalance that is still open.
– The midpoint (consequent encroachment, CE) is drawn as a line while it is inside the unfilled part.
– A gap is removed when price trades through its far edge (or, if you prefer, only when a bar closes through it).
– A bar that closes through a gap turns it into an iFVG: a bullish gap becomes resistance, a bearish gap becomes support. iFVGs are drawn with a dashed border in the colour of their new role and are removed when a bar closes back through them.
– Only the gaps closest to price are drawn (6 FVGs and 3 iFVGs by default, and none farther than 10 ATR away). Every gap is still tracked for the statistics.
– Higher-timeframe gaps (on by default): up to two higher timeframes, picked automatically from the chart timeframe (for example 4H and daily on a 15-minute chart) or set manually. They are drawn behind the chart's own gaps as outlined zones with a light fill, a dashed midpoint, a timeframe tag in the corner and a label such as "4H FVG", so you can see where a lower-timeframe gap sits inside a higher-timeframe imbalance. They follow the same lifecycle (shrinking, removal, inversion) on the current chart.
– Hover a label for the gap's range, size in ATR, the session it formed in, its current state and its age.
• Statistics panel (bullish and bearish side by side)
– Live FVGs and iFVGs.
– Lifecycle funnel: gaps formed, and the share that were touched, reached the midpoint, were fully filled, and were closed through (iFVG).
– First-touch test: on the first touch, a limit entry at the gap edge (or at the midpoint), a stop beyond the far edge plus a small ATR buffer, and a target in R (2R by default) with a maximum holding time. The result is shown as win rate, average R and number of tests for all gaps, by size (small, medium, large in ATR) and by the session the gap formed in (Asia, London, New York, other hours), plus the same test on the first retest of an iFVG. Results with an average above +0.05R are shown green and below −0.05R red (with at least 20 tests).
HOW IT WORKS
1. A gap is confirmed on the close of the third candle and is followed from the next bar.
2. Every closed bar is checked against each live gap in this order: first touch, midpoint, close through (iFVG) or trade through (filled). The unfilled part is updated from the bar's low or high.
3. In the first-touch test, a stop that could have been hit on the entry bar is counted as a loss, a target is never counted on the entry bar, and gaps through the stop or target fill at the open. When the maximum holding time ends, the test closes at that bar's close. Results are in R and before costs.
4. Higher-timeframe gaps are taken from closed higher-timeframe bars only and are not part of the statistics.
HOW TO USE IT
• Read the funnel to see how your market treats gaps. A high fill rate means gaps tend to be closed; a high inversion rate means closes through gaps are common and iFVGs deserve attention.
• Use the first-touch rows to compare gap sizes and sessions before trusting a setup. Compare edge entries with midpoint entries by switching the test entry.
• The average R is before commission and slippage. On low timeframes, costs can be a large share of the risk, so a small positive average may not survive them.
SETTINGS
Detection (bullish/bearish, minimum size, displacement, merging of gaps from one impulse, fill rule, iFVGs on or off, maximum age), higher-timeframe gaps (two timeframes, auto or manual, number shown, fill, border and colours), display (number of FVGs and iFVGs shown, maximum distance from price, shrinking, transparency, borders, midpoint line and style, labels, right extension, inversion marks), colours and label text, and the statistics (test entry, stop buffer, target in R, maximum bars, size buckets, session times and timezone, panel position and text size). Alerts are available for new gaps, first touches, inversions and iFVG retests.
LIMITATIONS
• Lifecycle steps are evaluated on closed bars, so the chart can differ from what happened inside a bar. Nothing changes after a bar closes.
• The first-touch test is a fixed, simplified measurement, not a complete trading system, and it does not include costs.
• Statistics describe the history loaded on your chart and depend on the settings, the symbol, the timeframe and the data feed. They are a measurement, not a forecast, and testing many settings on the same data increases the risk of overfitting.
This script is for analysis and education. It does not provide trading advice, and past behaviour shown on the chart does not imply future results.
Most FVG tools only draw boxes. This one is built to answer which gaps are worth paying attention to.
WHAT IT SHOWS
• Fair value gaps
A bullish FVG forms when the low of candle 3 is above the high of candle 1, leaving a price range the middle candle moved through without overlap. A bearish FVG is the mirror image. Two filters remove weak gaps:
– Minimum size in ATR(14), so the same setting works on any symbol and timeframe.
– Displacement: the middle candle must close in the direction of the gap with a body of at least a chosen number of ATR (0 = off).
A strong move often leaves several overlapping gaps on consecutive candles. By default these are merged into one gap, because they are one imbalance created by one move.
• Lifecycle on the chart
– Untouched gaps are drawn with full shading. Tapped gaps are drawn lighter.
– With "Shrink to the unfilled part" on, the box shrinks as price trades into it, so you always see the part of the imbalance that is still open.
– The midpoint (consequent encroachment, CE) is drawn as a line while it is inside the unfilled part.
– A gap is removed when price trades through its far edge (or, if you prefer, only when a bar closes through it).
– A bar that closes through a gap turns it into an iFVG: a bullish gap becomes resistance, a bearish gap becomes support. iFVGs are drawn with a dashed border in the colour of their new role and are removed when a bar closes back through them.
– Only the gaps closest to price are drawn (6 FVGs and 3 iFVGs by default, and none farther than 10 ATR away). Every gap is still tracked for the statistics.
– Higher-timeframe gaps (on by default): up to two higher timeframes, picked automatically from the chart timeframe (for example 4H and daily on a 15-minute chart) or set manually. They are drawn behind the chart's own gaps as outlined zones with a light fill, a dashed midpoint, a timeframe tag in the corner and a label such as "4H FVG", so you can see where a lower-timeframe gap sits inside a higher-timeframe imbalance. They follow the same lifecycle (shrinking, removal, inversion) on the current chart.
– Hover a label for the gap's range, size in ATR, the session it formed in, its current state and its age.
• Statistics panel (bullish and bearish side by side)
– Live FVGs and iFVGs.
– Lifecycle funnel: gaps formed, and the share that were touched, reached the midpoint, were fully filled, and were closed through (iFVG).
– First-touch test: on the first touch, a limit entry at the gap edge (or at the midpoint), a stop beyond the far edge plus a small ATR buffer, and a target in R (2R by default) with a maximum holding time. The result is shown as win rate, average R and number of tests for all gaps, by size (small, medium, large in ATR) and by the session the gap formed in (Asia, London, New York, other hours), plus the same test on the first retest of an iFVG. Results with an average above +0.05R are shown green and below −0.05R red (with at least 20 tests).
HOW IT WORKS
1. A gap is confirmed on the close of the third candle and is followed from the next bar.
2. Every closed bar is checked against each live gap in this order: first touch, midpoint, close through (iFVG) or trade through (filled). The unfilled part is updated from the bar's low or high.
3. In the first-touch test, a stop that could have been hit on the entry bar is counted as a loss, a target is never counted on the entry bar, and gaps through the stop or target fill at the open. When the maximum holding time ends, the test closes at that bar's close. Results are in R and before costs.
4. Higher-timeframe gaps are taken from closed higher-timeframe bars only and are not part of the statistics.
HOW TO USE IT
• Read the funnel to see how your market treats gaps. A high fill rate means gaps tend to be closed; a high inversion rate means closes through gaps are common and iFVGs deserve attention.
• Use the first-touch rows to compare gap sizes and sessions before trusting a setup. Compare edge entries with midpoint entries by switching the test entry.
• The average R is before commission and slippage. On low timeframes, costs can be a large share of the risk, so a small positive average may not survive them.
SETTINGS
Detection (bullish/bearish, minimum size, displacement, merging of gaps from one impulse, fill rule, iFVGs on or off, maximum age), higher-timeframe gaps (two timeframes, auto or manual, number shown, fill, border and colours), display (number of FVGs and iFVGs shown, maximum distance from price, shrinking, transparency, borders, midpoint line and style, labels, right extension, inversion marks), colours and label text, and the statistics (test entry, stop buffer, target in R, maximum bars, size buckets, session times and timezone, panel position and text size). Alerts are available for new gaps, first touches, inversions and iFVG retests.
LIMITATIONS
• Lifecycle steps are evaluated on closed bars, so the chart can differ from what happened inside a bar. Nothing changes after a bar closes.
• The first-touch test is a fixed, simplified measurement, not a complete trading system, and it does not include costs.
• Statistics describe the history loaded on your chart and depend on the settings, the symbol, the timeframe and the data feed. They are a measurement, not a forecast, and testing many settings on the same data increases the risk of overfitting.
This script is for analysis and education. It does not provide trading advice, and past behaviour shown on the chart does not imply future results.

Free live order book heatmap, footprint and CVD for BTC, gold and 7 more markets: swiftedge.uk/bitcoin-order-book-heatmap
Thông báo miễn trừ trách nhiệm
Thông tin và các ấn phẩm này không nhằm mục đích, và không cấu thành, lời khuyên hoặc khuyến nghị về tài chính, đầu tư, giao dịch hay các loại khác do TradingView cung cấp hoặc xác nhận. Đọc thêm tại Điều khoản Sử dụng.
Free live order book heatmap, footprint and CVD for BTC, gold and 7 more markets: swiftedge.uk/bitcoin-order-book-heatmap
Thông báo miễn trừ trách nhiệm
Thông tin và các ấn phẩm này không nhằm mục đích, và không cấu thành, lời khuyên hoặc khuyến nghị về tài chính, đầu tư, giao dịch hay các loại khác do TradingView cung cấp hoặc xác nhận. Đọc thêm tại Điều khoản Sử dụng.