Cập nhật
Double ROC (Acceleration) by Ocean Drive
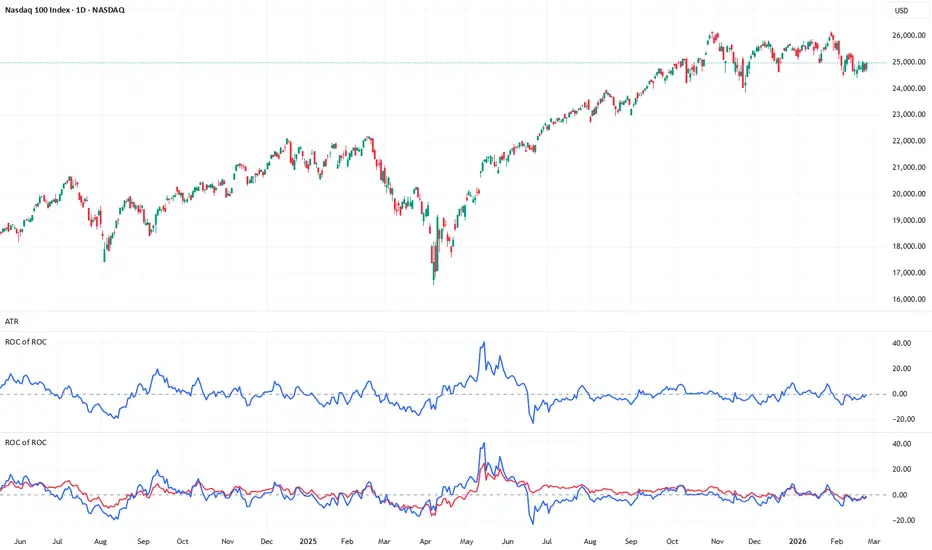
Overview
The Double ROC (Rate of Change) is a second-derivative momentum indicator designed to measure the acceleration and deceleration of price trends. While a standard ROC measures the velocity of price (first derivative), this indicator measures the velocity of the ROC itself, effectively plotting the acceleration (second derivative).
Mathematical Logic & Design
A common structural flaw when building an "ROC of ROC" is applying a standard percentage change formula to the first ROC. Because the inner ROC is an oscillator that crosses the zero line, this approach inevitably leads to severe mathematical distortions and divide-by-zero errors.
To solve this, this script calculates the absolute momentum (ta.change) of the Inner ROC over the Outer ROC lookback period. This ensures a mathematically stable and accurate reading of momentum acceleration without extreme outlier spikes.
How to Read and Apply
Zero Line Crossings: A cross above the zero line indicates that upward momentum is accelerating. A cross below the zero line indicates that downward momentum is accelerating.
Divergence: This is a leading indicator for structural shifts. If the price makes a higher high but the Double ROC makes a lower high, the prevailing uptrend is losing momentum (decelerating) and a reversal may be imminent.
Trend Exhaustion: Extreme peaks or troughs in the indicator often align with intermediate-term or macroeconomic inflection points, signaling that the current price velocity is unsustainable.
Inputs
Inner ROC Length (Momentum): The lookback period for the base price velocity. (Default: 25)
Outer ROC Length (Acceleration): The lookback period used to measure the acceleration of the Inner ROC. (Default: 25)
Source: The price data used for calculation. (Default: Close)
The Double ROC (Rate of Change) is a second-derivative momentum indicator designed to measure the acceleration and deceleration of price trends. While a standard ROC measures the velocity of price (first derivative), this indicator measures the velocity of the ROC itself, effectively plotting the acceleration (second derivative).
Mathematical Logic & Design
A common structural flaw when building an "ROC of ROC" is applying a standard percentage change formula to the first ROC. Because the inner ROC is an oscillator that crosses the zero line, this approach inevitably leads to severe mathematical distortions and divide-by-zero errors.
To solve this, this script calculates the absolute momentum (ta.change) of the Inner ROC over the Outer ROC lookback period. This ensures a mathematically stable and accurate reading of momentum acceleration without extreme outlier spikes.
How to Read and Apply
Zero Line Crossings: A cross above the zero line indicates that upward momentum is accelerating. A cross below the zero line indicates that downward momentum is accelerating.
Divergence: This is a leading indicator for structural shifts. If the price makes a higher high but the Double ROC makes a lower high, the prevailing uptrend is losing momentum (decelerating) and a reversal may be imminent.
Trend Exhaustion: Extreme peaks or troughs in the indicator often align with intermediate-term or macroeconomic inflection points, signaling that the current price velocity is unsustainable.
Inputs
Inner ROC Length (Momentum): The lookback period for the base price velocity. (Default: 25)
Outer ROC Length (Acceleration): The lookback period used to measure the acceleration of the Inner ROC. (Default: 25)
Source: The price data used for calculation. (Default: Close)
Phát hành các Ghi chú
Update NotesAdded the Inner ROC plot to the indicator. You can now monitor both the primary momentum (velocity) and the secondary momentum (acceleration) simultaneously in a single pane for better context.
Overview
The Double ROC (Rate of Change) indicator tracks both the intermediate-term momentum of price (Inner ROC) and its acceleration (Outer ROC). By displaying both lines, it provides a comprehensive view of trend velocity and its underlying strength, making it easier to identify structural shifts in the market.
Mathematical Logic & Design
A common structural flaw when building an "ROC of ROC" is applying a standard percentage change formula to the first ROC. Because the inner ROC is an oscillator that crosses the zero line, this approach inevitably leads to severe mathematical distortions and divide-by-zero errors.
To solve this, the Outer ROC (acceleration) is calculated using the absolute momentum (ta.change) of the Inner ROC. This ensures a mathematically stable reading.
How to Read and Apply
Inner ROC (Velocity): Represents the standard price momentum. Crosses above or below the zero line indicate primary bullish or bearish momentum shifts.
Outer ROC (Acceleration): Represents the acceleration of the momentum. A cross above the zero line means the current momentum (whether up or down) is accelerating. A cross below means it is decelerating.
Divergence: If the price makes a higher high but the indicator lines (especially the Outer ROC) make a lower high, the prevailing trend is losing its driving force and a reversal may be imminent.
Inputs
Inner ROC Length (Momentum): The lookback period for the base price velocity. (Default: 25)
Outer ROC Length (Acceleration): The lookback period used to measure the acceleration of the Inner ROC. (Default: 25)
Source: The price data used for calculation. (Default: Close)

Thông báo miễn trừ trách nhiệm
Thông tin và các ấn phẩm này không nhằm mục đích, và không cấu thành, lời khuyên hoặc khuyến nghị về tài chính, đầu tư, giao dịch hay các loại khác do TradingView cung cấp hoặc xác nhận. Đọc thêm tại Điều khoản Sử dụng.
Thông báo miễn trừ trách nhiệm
Thông tin và các ấn phẩm này không nhằm mục đích, và không cấu thành, lời khuyên hoặc khuyến nghị về tài chính, đầu tư, giao dịch hay các loại khác do TradingView cung cấp hoặc xác nhận. Đọc thêm tại Điều khoản Sử dụng.