OPEN-SOURCE SCRIPT
BTC Halving Indicator
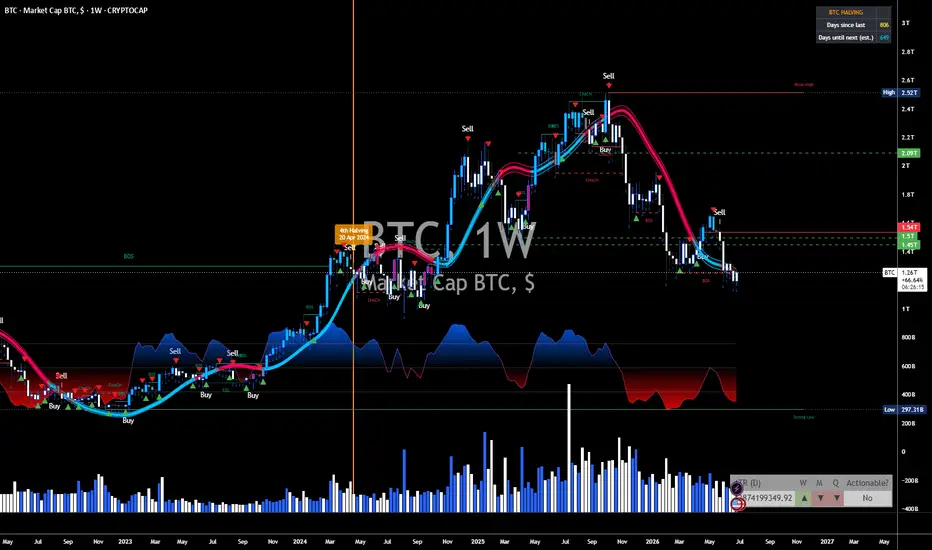
**What it does:**
- Draws an **orange vertical line + label** at each past halving: 28 Nov 2012, 9 Jul 2016, 11 May 2020, and 20 Apr 2024
- Draws a **dashed aqua line** at the estimated 5th halving (~April 2028) when it's close enough to appear on your chart
- Shows a **live counter table** in the top-right: days since the last halving and estimated days until the next one
- Has settings to change colors and toggle the labels/counter on or off
**How to install it in TradingView:**
1. Open a BTC chart (e.g. BTCUSD) on tradingview.com
2. Click **Pine Editor** at the bottom of the screen
3. Delete whatever's in the editor, paste in the full contents of the file
4. Click **Save**, then **Add to chart**
Two tips: use the **daily or weekly timeframe** — on low timeframes like 5m, TradingView doesn't load history back to 2012, so the older halving lines won't appear. And note the 2028 date is an estimate; the actual halving happens at block 1,050,000, so the real date drifts slightly with block times.
Want me to add anything, like cycle-phase background shading or price-at-halving markers?
Mã nguồn mở
Theo đúng tinh thần TradingView, tác giả của tập lệnh này đã công bố nó dưới dạng mã nguồn mở, để các nhà giao dịch có thể xem xét và xác minh chức năng. Chúc mừng tác giả! Mặc dù bạn có thể sử dụng miễn phí, hãy nhớ rằng việc công bố lại mã phải tuân theo Nội quy.

Thông báo miễn trừ trách nhiệm
Thông tin và các ấn phẩm này không nhằm mục đích, và không cấu thành, lời khuyên hoặc khuyến nghị về tài chính, đầu tư, giao dịch hay các loại khác do TradingView cung cấp hoặc xác nhận. Đọc thêm tại Điều khoản Sử dụng.
Mã nguồn mở
Theo đúng tinh thần TradingView, tác giả của tập lệnh này đã công bố nó dưới dạng mã nguồn mở, để các nhà giao dịch có thể xem xét và xác minh chức năng. Chúc mừng tác giả! Mặc dù bạn có thể sử dụng miễn phí, hãy nhớ rằng việc công bố lại mã phải tuân theo Nội quy.
Thông báo miễn trừ trách nhiệm
Thông tin và các ấn phẩm này không nhằm mục đích, và không cấu thành, lời khuyên hoặc khuyến nghị về tài chính, đầu tư, giao dịch hay các loại khác do TradingView cung cấp hoặc xác nhận. Đọc thêm tại Điều khoản Sử dụng.