Holding-Period Outcomes
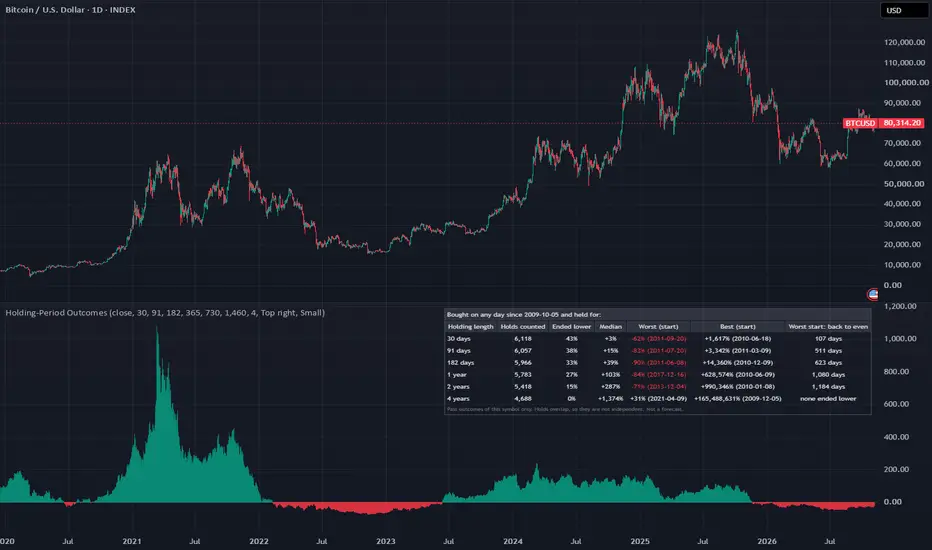
This indicator answers one question about any symbol: if you had bought on any day in its history and held for a fixed time, how did that hold end?
HOW IT WORKS
For every day on the chart it buys at that day's close and sells at the close of the first day on which the holding length has passed. It does this for up to six holding lengths, in calendar days, and counts every hold that has finished.
For each holding length the table shows:
- Holds counted: how many finished holds there are.
- Ended lower: the share of holds that ended below the price they were bought at.
- Median: the middle outcome. Half the holds did better, half did worse.
- Worst and best: the two most extreme outcomes, with the day each one was bought.
- Worst start, back to even: after the worst hold ended, how long it was from the day it was bought until the price closed at or above that day's price again. It reads "not yet" if that has not happened, and "none ended lower" if no hold of that length ended below its start.
The bars in the pane show, for one holding length you choose, the outcome of the hold that ends on each bar. They use only prices up to that bar, so they do not repaint. The current day's bar moves with the price until the day closes; past bars never change.
HOW TO USE IT
- Add it to a daily (1D) chart of any symbol. It reads only that symbol's prices. On any other timeframe it shows one line, "Made for a daily chart", and nothing else.
- Set the holding lengths you care about. 0 hides a row.
- "Count starts from" leaves out an early period, or compares two eras of the same symbol.
WHY IT IS USEFUL
A chart shows where a price went. It does not show how often someone who bought and waited was down at the end, or how long the worst entry took to come back. Those are the numbers a buyer lives through, and the answer for a month is not the answer for four years.
LIMITATIONS
- Holds overlap. A one-year hold that starts today shares most of its days with one that started yesterday, so the counts are not independent samples, and one long fall can account for many of the holds that ended lower.
- It describes this symbol's past only. A symbol still on the chart is one that survived; one that was delisted may not be on TradingView at all.
- It uses prices only. Dividends, fees, funding, interest and taxes are not included unless the symbol includes them.
- It is a study of the past, not a forecast and not financial advice.
HOW IT WORKS
For every day on the chart it buys at that day's close and sells at the close of the first day on which the holding length has passed. It does this for up to six holding lengths, in calendar days, and counts every hold that has finished.
For each holding length the table shows:
- Holds counted: how many finished holds there are.
- Ended lower: the share of holds that ended below the price they were bought at.
- Median: the middle outcome. Half the holds did better, half did worse.
- Worst and best: the two most extreme outcomes, with the day each one was bought.
- Worst start, back to even: after the worst hold ended, how long it was from the day it was bought until the price closed at or above that day's price again. It reads "not yet" if that has not happened, and "none ended lower" if no hold of that length ended below its start.
The bars in the pane show, for one holding length you choose, the outcome of the hold that ends on each bar. They use only prices up to that bar, so they do not repaint. The current day's bar moves with the price until the day closes; past bars never change.
HOW TO USE IT
- Add it to a daily (1D) chart of any symbol. It reads only that symbol's prices. On any other timeframe it shows one line, "Made for a daily chart", and nothing else.
- Set the holding lengths you care about. 0 hides a row.
- "Count starts from" leaves out an early period, or compares two eras of the same symbol.
WHY IT IS USEFUL
A chart shows where a price went. It does not show how often someone who bought and waited was down at the end, or how long the worst entry took to come back. Those are the numbers a buyer lives through, and the answer for a month is not the answer for four years.
LIMITATIONS
- Holds overlap. A one-year hold that starts today shares most of its days with one that started yesterday, so the counts are not independent samples, and one long fall can account for many of the holds that ended lower.
- It describes this symbol's past only. A symbol still on the chart is one that survived; one that was delisted may not be on TradingView at all.
- It uses prices only. Dividends, fees, funding, interest and taxes are not included unless the symbol includes them.
- It is a study of the past, not a forecast and not financial advice.

Public record of every call: verocompass.github.io/vero-compass-record/
Thông báo miễn trừ trách nhiệm
Thông tin và các ấn phẩm này không nhằm mục đích, và không cấu thành, lời khuyên hoặc khuyến nghị về tài chính, đầu tư, giao dịch hay các loại khác do TradingView cung cấp hoặc xác nhận. Đọc thêm tại Điều khoản Sử dụng.
Public record of every call: verocompass.github.io/vero-compass-record/
Thông báo miễn trừ trách nhiệm
Thông tin và các ấn phẩm này không nhằm mục đích, và không cấu thành, lời khuyên hoặc khuyến nghị về tài chính, đầu tư, giao dịch hay các loại khác do TradingView cung cấp hoặc xác nhận. Đọc thêm tại Điều khoản Sử dụng.