Cập nhật
Multi Timeframe (i)FVG Analysis [BMT]
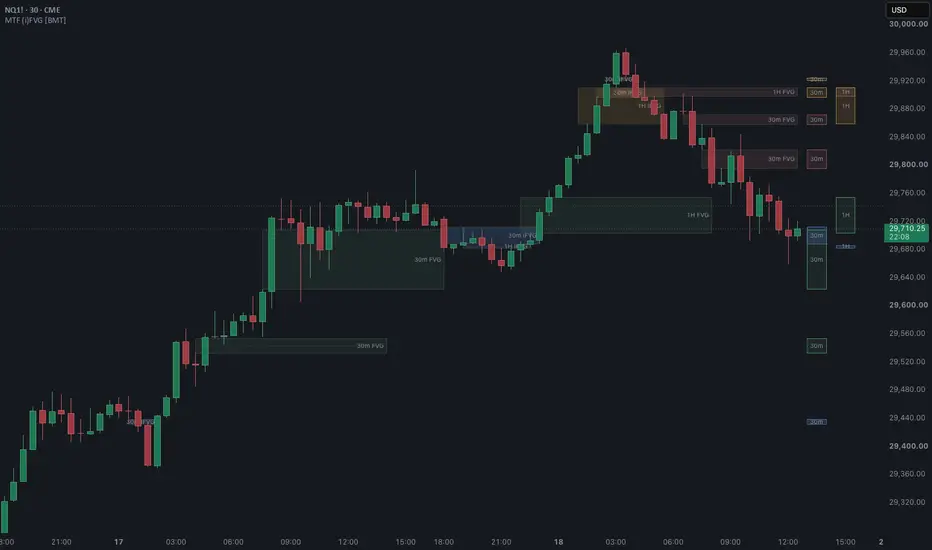
Multi Timeframe (i)FVG Analysis [BMT]
Fair value gaps and inverted fair value gaps on the chart timeframe and up to three higher timeframes, with a lifecycle per gap, relevance filters so a higher-timeframe view does not bury the chart, a directional bias that filters what you see and hear, and alerts.
WHAT IT DRAWS
A fair value gap (FVG) is a three-bar imbalance: a bullish FVG is the space between bar one's high and bar three's low when bar three's low is above bar one's high and bar two closed above it; a bearish FVG is the mirror. Each gap is a box from the bar that formed it, with an optional dotted midpoint line.
Every gap has three states, tracked separately on every enabled timeframe:
The mitigation test can be the close (default) or the high and low.
TIMEFRAMES
One row per timeframe: the chart timeframe plus H1, H2 and H3. Each row has its own timeframe, a Both / FVG / iFVG / Off switch, and a display filter. Off skips that timeframe entirely, including its data request. "auto" picks a higher timeframe paired to the chart timeframe (1 to 15, 5 to 60, 15 to 240, 60 to daily, and so on).
The defaults draw the chart timeframe only. Turn a higher timeframe on from its Off switch; the rows come preset to 15 minutes, 1 hour and 4 hours.
FILTERS
Three per timeframe.
The lookback is settable (300 bars by default). Boxes run a settable number of bars from where they formed, measured in chart bars by default so a higher-timeframe box does not take over a low-timeframe chart, or in the box's own timeframe if you prefer the longer projection. Extend Boxes runs every live box to the right edge, capped at a settable number of bars past the last bar.
BIAS
Neutral, Bullish or Bearish. It filters what is drawn and which alerts fire; every gap is still tracked underneath, because a gap against your bias is the one that may invert your way.
Bullish: bullish FVGs and bullish iFVGs drawn normally, bearish FVGs dimmed as inversion candidates, bearish iFVGs hidden. Alerts fire for a bullish FVG forming, a bearish FVG inverting, and price entering a bullish FVG. Bearish is the mirror. Neutral shows everything.
ALERTS
Six conditions in the alert dialog, each covering any enabled timeframe:
"Entered" fires the first time the chart bar trades inside a live gap.
Turn on "Send alert() messages" and choose "Any alert() function call" to get one message per event that names the symbol, the timeframe and the gap's levels. Events fire on every tracked gap whether or not the display filter is currently showing it. Without "Wait for bar close", a chart-timeframe gap is reported as soon as it appears intra-bar and can be withdrawn if the bar closes back over it.
THEME
Auto reads the chart background and picks light or dark. Light is the traditional green and red. Dark is built for a dark canvas: fills sit a little above the background so they do not fight the candles, and the two sides are matched in brightness rather than in transparency. Custom exposes the six colors, the border, and the counter-bias dim as inputs, since box colors are not on the Style tab.
STATUS TABLE
Optional, hidden by default. One row per timeframe with the filter in use and live counts of FVGs and iFVGs per side, plus the chart ATR.
NOTES
Every higher timeframe is one request.security call. A gap on a higher timeframe is detected when that timeframe's bar prints it, not on close, unless "Wait for bar close" is on.
Fair value gaps and inverted fair value gaps on the chart timeframe and up to three higher timeframes, with a lifecycle per gap, relevance filters so a higher-timeframe view does not bury the chart, a directional bias that filters what you see and hear, and alerts.
WHAT IT DRAWS
A fair value gap (FVG) is a three-bar imbalance: a bullish FVG is the space between bar one's high and bar three's low when bar three's low is above bar one's high and bar two closed above it; a bearish FVG is the mirror. Each gap is a box from the bar that formed it, with an optional dotted midpoint line.
Every gap has three states, tracked separately on every enabled timeframe:
- FVG: live, price has not closed through it.
- iFVG (inverted): price has closed through the far side. A bullish FVG that fails becomes a bearish iFVG and is redrawn in the iFVG color; a bearish FVG that fails becomes a bullish iFVG. The inverted level is drawn brighter than a plain FVG because it is the more actionable one.
- Mitigated: price has closed back through an iFVG, and it is removed.
The mitigation test can be the close (default) or the high and low.
TIMEFRAMES
One row per timeframe: the chart timeframe plus H1, H2 and H3. Each row has its own timeframe, a Both / FVG / iFVG / Off switch, and a display filter. Off skips that timeframe entirely, including its data request. "auto" picks a higher timeframe paired to the chart timeframe (1 to 15, 5 to 60, 15 to 240, 60 to daily, and so on).
The defaults draw the chart timeframe only. Turn a higher timeframe on from its Off switch; the rows come preset to 15 minutes, 1 hour and 4 hours.
FILTERS
Three per timeframe.
- All draws every live box.
- N draws the newest N per side.
- ATR draws only boxes within N ATRs of the current price, measured with that timeframe's own ATR(14) rather than the chart's, so "within 1 ATR" means the same thing on a 4-hour box and a 5-minute one.
The lookback is settable (300 bars by default). Boxes run a settable number of bars from where they formed, measured in chart bars by default so a higher-timeframe box does not take over a low-timeframe chart, or in the box's own timeframe if you prefer the longer projection. Extend Boxes runs every live box to the right edge, capped at a settable number of bars past the last bar.
BIAS
Neutral, Bullish or Bearish. It filters what is drawn and which alerts fire; every gap is still tracked underneath, because a gap against your bias is the one that may invert your way.
Bullish: bullish FVGs and bullish iFVGs drawn normally, bearish FVGs dimmed as inversion candidates, bearish iFVGs hidden. Alerts fire for a bullish FVG forming, a bearish FVG inverting, and price entering a bullish FVG. Bearish is the mirror. Neutral shows everything.
ALERTS
Six conditions in the alert dialog, each covering any enabled timeframe:
- bullish FVG formed,
- bearish FVG formed,
- bullish FVG inverted,
- bearish FVG inverted,
- price entered a bullish FVG,
- price entered a bearish FVG.
"Entered" fires the first time the chart bar trades inside a live gap.
Turn on "Send alert() messages" and choose "Any alert() function call" to get one message per event that names the symbol, the timeframe and the gap's levels. Events fire on every tracked gap whether or not the display filter is currently showing it. Without "Wait for bar close", a chart-timeframe gap is reported as soon as it appears intra-bar and can be withdrawn if the bar closes back over it.
THEME
Auto reads the chart background and picks light or dark. Light is the traditional green and red. Dark is built for a dark canvas: fills sit a little above the background so they do not fight the candles, and the two sides are matched in brightness rather than in transparency. Custom exposes the six colors, the border, and the counter-bias dim as inputs, since box colors are not on the Style tab.
STATUS TABLE
Optional, hidden by default. One row per timeframe with the filter in use and live counts of FVGs and iFVGs per side, plus the chart ATR.
NOTES
Every higher timeframe is one request.security call. A gap on a higher timeframe is detected when that timeframe's bar prints it, not on close, unless "Wait for bar close" is on.
Phát hành các Ghi chú
v0.4.0Changed
- Bias is now a preset over per-timeframe gap types. Bullish shows every type on the chart timeframe and only -FVG and +iFVG on the higher ones (bearish gaps as inversion candidates, and the bullish iFVGs they become); Bearish is the mirror; Neutral shows everything. A new Custom option hands the choice to +FVG, -FVG, +iFVG and -iFVG ticks under each timeframe row, named by the direction the box trades as. The old Bias applied one rule to every timeframe and dimmed counter-bias gaps; the dim is gone, since a type is now either shown or not.
- Duplicate timeframes draw once. When "chart" or "auto" resolves to another row's timeframe, or two fixed rows match, the earliest row draws and the rest are skipped (L1, then H1, H2, H3; "Favor LTF boxes over identical HTF" off lets a higher-timeframe row beat L1). Only rows that are themselves drawing count, so an off row no longer blocks anything.
- Faster load. Gaps are still tracked on every bar of the lookback, but boxes are now drawn on the last bar only instead of being deleted and redrawn on every historical bar, and the higher-timeframe bar buffers fill as bars arrive instead of rescanning history on every chart bar. The lookback length was not the cost and is unchanged at 300.
- Status table: the iFVG pair now reads bullish then bearish like the FVG pair, "auto" and "chart" rows show the timeframe they resolved to, and a switched-on row that is not drawing says why.
Changed defaults (existing charts keep their saved inputs)
- Chart timeframe filter: within 3 ATRs of price, was All.
- "Hide boxes lower than chart timeframe" is on.
Removed
- Weekly session-open highlight.
Fixed
- Setting L1 to 2H, 3H or 4H sent an invalid timeframe string to the data request.
Phát hành các Ghi chú
v0.4.1New
- Layout input under Box Settings. Columns at right edge draws every box that passes the filters as a narrow box past the last bar, at its own price levels, one column per drawing timeframe with the chart timeframe nearest price and H1 to H3 outward. Both keeps the on-chart boxes as well. Column width, gap and offset are inputs; Extend Boxes, midpoint lines and the max-bars cap apply to the on-chart boxes only.
Changed
- "Draw iFVG boxes past the inversion", off by default. On, an inverted gap draws as two boxes: its time as an FVG in that color, faded, then the iFVG box from the bar that inverted it, running the box length forward or to the right edge under Extend Boxes, which is where the support or resistance reading applies. Off, the box runs from formation to inversion in the iFVG color, as before.
- Column boxes carry a border in their own color, every theme. The dark fills are deliberately close to the canvas, and a two-bar box of that fill reads as a faint gray rectangle; the border makes it legible and the four colors say what each one is. On-chart boxes are unchanged.
- With columns on, on-chart boxes stop at the last bar, so the column offset is empty space before the first column.
Changed defaults (existing charts keep their saved inputs)
- H1 to H3 filter: ATR, was N. The numbers carry over as ATR multiples: 2, 2 and 1 of each row's own ATR.
- Neutral bias draws FVGs only on the chart timeframe (every type on H1 to H3 as before), so a fresh add shows the chart timeframe's FVGs and nothing else.
Phát hành các Ghi chú
v0.4.2New
- "Outline boxes in their own color" under Box Settings, off by default. Every on-chart box gets a thin border in its own color, the way the right-edge columns already were, so it stands out from the candles at a normal zoom; the midpoint line follows it. Off restores the theme's border.
Changed
- Dark theme boxes are easier to see. The FVG and iFVG fills are roughly twice as far from the background as before, still under the candles, and the two sides still match in brightness. All four colors are more saturated and the bearish iFVG amber is now orange, since the old muted shades read as gray teal, gray pink, slate and olive brown. The on-chart border is lighter to match. Light and Custom are unchanged.

Thông báo miễn trừ trách nhiệm
Thông tin và các ấn phẩm này không nhằm mục đích, và không cấu thành, lời khuyên hoặc khuyến nghị về tài chính, đầu tư, giao dịch hay các loại khác do TradingView cung cấp hoặc xác nhận. Đọc thêm tại Điều khoản Sử dụng.
Thông báo miễn trừ trách nhiệm
Thông tin và các ấn phẩm này không nhằm mục đích, và không cấu thành, lời khuyên hoặc khuyến nghị về tài chính, đầu tư, giao dịch hay các loại khác do TradingView cung cấp hoặc xác nhận. Đọc thêm tại Điều khoản Sử dụng.