OPEN-SOURCE SCRIPT
Cập nhật Precision VWAP Chase
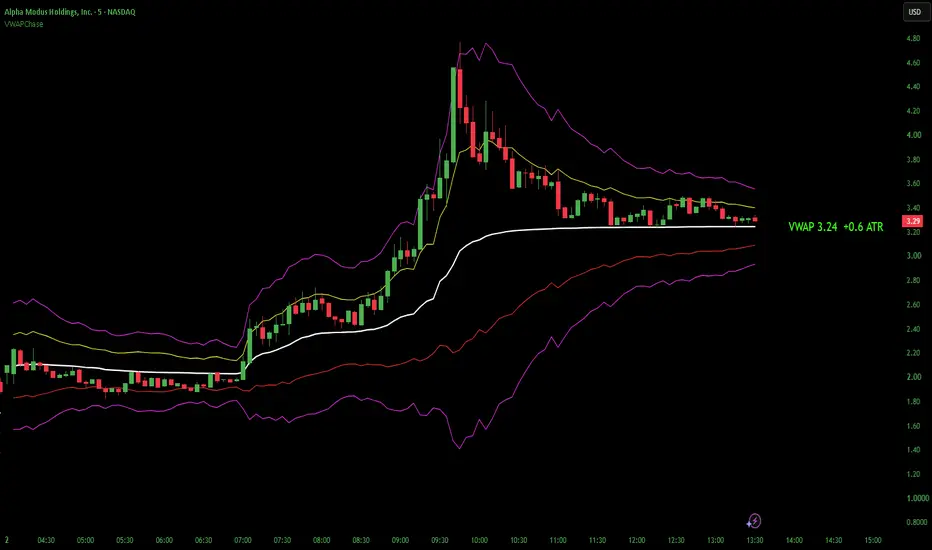
WHAT VWAPCHASE IS
VWAPChase measures how far price is from session VWAP, in units of recent volatility. The reading is live price minus session VWAP, divided by a fixed 5-minute Wilder ATR(7). A reading of +2.5 means price is 2.5 times the current 5-minute ATR above VWAP. A reading of -1.0 means price is 1.0 times that ATR below it.
VWAP is the volume-weighted average traded price for the session. Distance from VWAP provides a simple reference for how far price has moved from that session average. When I'm looking at a runner, one question I keep asking is how far above VWAP I would be paying to participate. VWAPChase puts a number and color on that distance.
It measures displacement. It does not judge the trade. It does not know whether a stretched move is ending or just starting, and it never tells anyone to enter or exit.
WHAT MAKES IT DIFFERENT
The ruler is fixed. The ATR is always taken from 5-minute bars with a length of 7, whatever the chart timeframe. A 15-second chart, a 1-minute chart and a 15-minute chart give the same reading for the same price and VWAP. Switching timeframes changes the view, not the measurement.
The reading is live. It updates with live price and session VWAP while using 5-minute ATR as its fixed volatility reference. On a fast move, the reading climbs as the move happens instead of waiting for a bar to close.
The scale is symmetric. The same limits apply above and below VWAP, so a stretched move up and a stretched move down are measured the same way.
THE STATES
The label is colored by state using its displayed one-decimal reading. Each limit applies to both sides of VWAP.
Parabolic, +4.0 and above: magenta
Extended, +2.0 to +3.9: yellow
Moderate, +0.6 to +1.9: green
Near VWAP, -0.5 to +0.5: gray
Below VWAP, -0.6 to -1.9: orange
Extended Below, -2.0 to -3.9: red
Parabolic Below, -4.0 and below: magenta
The state is decided from the same one-decimal number the label shows, so a displayed +4.0 is always magenta and a displayed +2.0 is always yellow.
The colors describe distance from VWAP, not trend health. Green is not a buy signal and yellow is not a warning to stay out. A fresh breakout can print yellow because it is happening well above VWAP. A failing move can read green because the distance that remains is moderate. Read the state together with whatever you use for structure.
snapshot
THE LABEL
A text label sits at the right end of the VWAP line and shows VWAP and the current reading, for example VWAP 3.23 +1.7 ATR. Very large values, such as market capitalization charts, are abbreviated to T, B or M so the label stays readable.
Label Position can be set to On, Above or Below. Above and Below lift the text off the VWAP line so it does not collide with other indicators' lines. The label stays anchored to VWAP either way.
The label also explains when no reading is possible: on daily and higher charts, on symbols without volume data, and while the 5-minute ATR is still building at the start of the chart.
THRESHOLD LINES
Optional lines show where the label changes state. Upper Thresholds draws +2 (yellow) and +4 (magenta). Lower Thresholds draws -2 (red) and -4 (magenta). Both are off by default.
The lines use the same fixed 5-minute ATR as the reading and move with session VWAP. When volatility expands, you can watch them widen away from VWAP. When the session quiets down, they pull back in. That makes the normalization visible in a way the number alone cannot.
Thresholds are moving volatility boundaries, not support or resistance. Price can cross them freely; their purpose is to show where the extension state changes.
I prefer the threshold lines off, as illustrated in the image below.

Upper and lower threshold lines can be turned on separately. The following image shows the lower threshold lines on and the upper lines off.

SETTINGS
Tiers: Near VWAP, Extended and Parabolic limits, in ATR units. Each applies to both sides of VWAP. Defaults are 0.5, 2.0 and 4.0.
VWAP: show or hide the line, its color and width.
Thresholds: show the upper and lower threshold lines and their width.
Label: show or hide the label, its offset from the last bar, its position, its size, and the color of each state.
The ATR timeframe and length are not settings. The 5-minute ATR(7) is fixed so the reading means the same thing on every chart.
The reading is also in the Data Window and can be used as a Pine Screener column.
HOW TO READ IT
Watch how the reading changes, not only where it sits. A reading can reach magenta during a forming bar and fall back to yellow before the close. It can also remain magenta into the close. Because the reading is live, both behaviors remain visible instead of being reduced to a close-only value.
Gray means price is near VWAP. Repeated crossings around VWAP show that price is staying close to the session average.
Use it alongside a structure tool. Structure tells you what the move is doing. VWAPChase tells you how far from VWAP you are paying to take part in it.
DATA REQUIREMENTS
VWAP requires volume. Symbols that carry no volume, including many index and blended price symbols, show a no volume data message instead of a reading. Choose an exchange symbol that reports volume.
CFD and broker feeds may report tick volume rather than traded volume. VWAP still works on them but is weighted by activity rather than true volume. For crypto, use an exchange feed that reports volume.
Use extended hours on stocks so premarket trading counts in VWAP. A 24-hour session starts VWAP at the overnight open instead, which can shift the reading slightly.
LIMITATIONS
VWAPChase runs on intraday timeframes only.
Right before a breakout, quiet bars keep the 5-minute ATR small, so early readings on a new move run high. Right after a blow-off, the large bars swell the ATR, so readings for some time afterward run low. The threshold lines show both effects as they happen.
Session VWAP gets heavier as the day goes on. Late in a strong trend, the distance can keep growing partly because VWAP moves slowly, not only because price is stretching.
On lower timeframes, the threshold lines can step as the 5-minute ATR updates.
Readings on the forming bar can change before the bar closes.
VWAPChase has no alerts. It is a gauge, not an event detector. Alerts can be added in a future update if users find them useful.
VWAPChase does not predict future prices, does not manage risk and does not guarantee any outcome.
DISCLAIMER
VWAPChase's readings, colors, lines and label are analytical measurements derived from the rules described above, not recommendations to buy or sell. Trading decisions and risk management remain the user's responsibility.
VWAPChase measures how far price is from session VWAP, in units of recent volatility. The reading is live price minus session VWAP, divided by a fixed 5-minute Wilder ATR(7). A reading of +2.5 means price is 2.5 times the current 5-minute ATR above VWAP. A reading of -1.0 means price is 1.0 times that ATR below it.
VWAP is the volume-weighted average traded price for the session. Distance from VWAP provides a simple reference for how far price has moved from that session average. When I'm looking at a runner, one question I keep asking is how far above VWAP I would be paying to participate. VWAPChase puts a number and color on that distance.
It measures displacement. It does not judge the trade. It does not know whether a stretched move is ending or just starting, and it never tells anyone to enter or exit.
WHAT MAKES IT DIFFERENT
The ruler is fixed. The ATR is always taken from 5-minute bars with a length of 7, whatever the chart timeframe. A 15-second chart, a 1-minute chart and a 15-minute chart give the same reading for the same price and VWAP. Switching timeframes changes the view, not the measurement.
The reading is live. It updates with live price and session VWAP while using 5-minute ATR as its fixed volatility reference. On a fast move, the reading climbs as the move happens instead of waiting for a bar to close.
The scale is symmetric. The same limits apply above and below VWAP, so a stretched move up and a stretched move down are measured the same way.
THE STATES
The label is colored by state using its displayed one-decimal reading. Each limit applies to both sides of VWAP.
Parabolic, +4.0 and above: magenta
Extended, +2.0 to +3.9: yellow
Moderate, +0.6 to +1.9: green
Near VWAP, -0.5 to +0.5: gray
Below VWAP, -0.6 to -1.9: orange
Extended Below, -2.0 to -3.9: red
Parabolic Below, -4.0 and below: magenta
The state is decided from the same one-decimal number the label shows, so a displayed +4.0 is always magenta and a displayed +2.0 is always yellow.
The colors describe distance from VWAP, not trend health. Green is not a buy signal and yellow is not a warning to stay out. A fresh breakout can print yellow because it is happening well above VWAP. A failing move can read green because the distance that remains is moderate. Read the state together with whatever you use for structure.
snapshot
THE LABEL
A text label sits at the right end of the VWAP line and shows VWAP and the current reading, for example VWAP 3.23 +1.7 ATR. Very large values, such as market capitalization charts, are abbreviated to T, B or M so the label stays readable.
Label Position can be set to On, Above or Below. Above and Below lift the text off the VWAP line so it does not collide with other indicators' lines. The label stays anchored to VWAP either way.
The label also explains when no reading is possible: on daily and higher charts, on symbols without volume data, and while the 5-minute ATR is still building at the start of the chart.
THRESHOLD LINES
Optional lines show where the label changes state. Upper Thresholds draws +2 (yellow) and +4 (magenta). Lower Thresholds draws -2 (red) and -4 (magenta). Both are off by default.
The lines use the same fixed 5-minute ATR as the reading and move with session VWAP. When volatility expands, you can watch them widen away from VWAP. When the session quiets down, they pull back in. That makes the normalization visible in a way the number alone cannot.
Thresholds are moving volatility boundaries, not support or resistance. Price can cross them freely; their purpose is to show where the extension state changes.
I prefer the threshold lines off, as illustrated in the image below.
Upper and lower threshold lines can be turned on separately. The following image shows the lower threshold lines on and the upper lines off.
SETTINGS
Tiers: Near VWAP, Extended and Parabolic limits, in ATR units. Each applies to both sides of VWAP. Defaults are 0.5, 2.0 and 4.0.
VWAP: show or hide the line, its color and width.
Thresholds: show the upper and lower threshold lines and their width.
Label: show or hide the label, its offset from the last bar, its position, its size, and the color of each state.
The ATR timeframe and length are not settings. The 5-minute ATR(7) is fixed so the reading means the same thing on every chart.
The reading is also in the Data Window and can be used as a Pine Screener column.
HOW TO READ IT
Watch how the reading changes, not only where it sits. A reading can reach magenta during a forming bar and fall back to yellow before the close. It can also remain magenta into the close. Because the reading is live, both behaviors remain visible instead of being reduced to a close-only value.
Gray means price is near VWAP. Repeated crossings around VWAP show that price is staying close to the session average.
Use it alongside a structure tool. Structure tells you what the move is doing. VWAPChase tells you how far from VWAP you are paying to take part in it.
DATA REQUIREMENTS
VWAP requires volume. Symbols that carry no volume, including many index and blended price symbols, show a no volume data message instead of a reading. Choose an exchange symbol that reports volume.
CFD and broker feeds may report tick volume rather than traded volume. VWAP still works on them but is weighted by activity rather than true volume. For crypto, use an exchange feed that reports volume.
Use extended hours on stocks so premarket trading counts in VWAP. A 24-hour session starts VWAP at the overnight open instead, which can shift the reading slightly.
LIMITATIONS
VWAPChase runs on intraday timeframes only.
Right before a breakout, quiet bars keep the 5-minute ATR small, so early readings on a new move run high. Right after a blow-off, the large bars swell the ATR, so readings for some time afterward run low. The threshold lines show both effects as they happen.
Session VWAP gets heavier as the day goes on. Late in a strong trend, the distance can keep growing partly because VWAP moves slowly, not only because price is stretching.
On lower timeframes, the threshold lines can step as the 5-minute ATR updates.
Readings on the forming bar can change before the bar closes.
VWAPChase has no alerts. It is a gauge, not an event detector. Alerts can be added in a future update if users find them useful.
VWAPChase does not predict future prices, does not manage risk and does not guarantee any outcome.
DISCLAIMER
VWAPChase's readings, colors, lines and label are analytical measurements derived from the rules described above, not recommendations to buy or sell. Trading decisions and risk management remain the user's responsibility.
Phát hành các Ghi chú
v1.1 — October 2026Fixed extreme readings when trading becomes unusually quiet. VWAPChase measures distance from VWAP using recent 5-minute volatility. During replay testing, I found that when trading nearly stopped (late after hours, quiet premarket, or while a stock sat dormant before a move), the 5-minute ATR could shrink dramatically. Even a small move away from VWAP could then appear Extended or Parabolic simply because the volatility ruler had become unusually small.
Added a collapse floor to the volatility ruler. VWAPChase now compares the live 5-minute ATR with the stock's normal 5-minute volatility over roughly the most recent five regular sessions. If the live ATR falls below about one-third of that normal level, the ruler is held at that one-third level instead. Extended-hours trading is excluded from the normal reference, so quiet premarket and after-hours periods cannot pull it lower.
Active trading is unchanged. When current 5-minute volatility is above the collapse floor, VWAPChase uses the same 5-minute ATR(7) calculation as v1.0. Launches, active pushes, pullbacks and normal intraday trading read exactly as before. A stock that slowly drifts far from VWAP after a large run can still produce a large reading, because VWAPChase measures displacement, not the speed of the move or the quality of a trade.
New settings: Collapse Threshold defaults to 0.35 and Normal ATR Length defaults to 390 regular-session 5-minute bars. Setting Collapse Threshold to 0 restores the original v1.0 ruler.
Limitation: on symbols with less than about five regular sessions of history, the collapse floor stays off until enough data is available.
Mã nguồn mở
Theo đúng tinh thần TradingView, tác giả của tập lệnh này đã công bố nó dưới dạng mã nguồn mở, để các nhà giao dịch có thể xem xét và xác minh chức năng. Chúc mừng tác giả! Mặc dù bạn có thể sử dụng miễn phí, hãy nhớ rằng việc công bố lại mã phải tuân theo Nội quy.

@MohaveTrader
Context First — Signals Second
Precision Trading Tools
Structure • Flow • Momentum
Context First — Signals Second
Precision Trading Tools
Structure • Flow • Momentum
Thông báo miễn trừ trách nhiệm
Thông tin và các ấn phẩm này không nhằm mục đích, và không cấu thành, lời khuyên hoặc khuyến nghị về tài chính, đầu tư, giao dịch hay các loại khác do TradingView cung cấp hoặc xác nhận. Đọc thêm tại Điều khoản Sử dụng.
Mã nguồn mở
Theo đúng tinh thần TradingView, tác giả của tập lệnh này đã công bố nó dưới dạng mã nguồn mở, để các nhà giao dịch có thể xem xét và xác minh chức năng. Chúc mừng tác giả! Mặc dù bạn có thể sử dụng miễn phí, hãy nhớ rằng việc công bố lại mã phải tuân theo Nội quy.
@MohaveTrader
Context First — Signals Second
Precision Trading Tools
Structure • Flow • Momentum
Context First — Signals Second
Precision Trading Tools
Structure • Flow • Momentum
Thông báo miễn trừ trách nhiệm
Thông tin và các ấn phẩm này không nhằm mục đích, và không cấu thành, lời khuyên hoặc khuyến nghị về tài chính, đầu tư, giao dịch hay các loại khác do TradingView cung cấp hoặc xác nhận. Đọc thêm tại Điều khoản Sử dụng.