OPEN-SOURCE SCRIPT
RSI with Bullish/ Bearish Zones by VKK
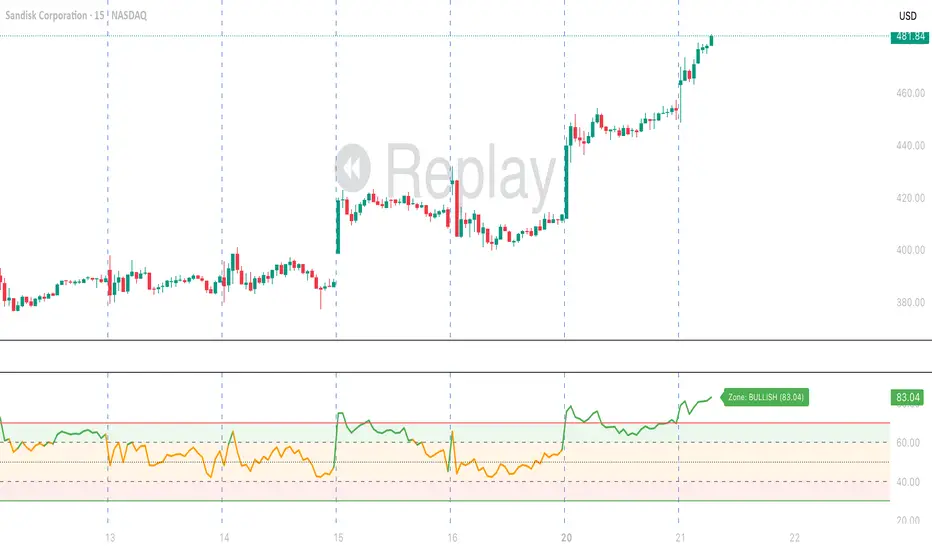
Disclaimer: Script is not suggesting any buy or sell any stock. It's a visual identification of the direction of the current state of the stock.
This script is a modified Relative Strength Index (RSI) designed to help traders filter out market noise by identifying three distinct momentum phases. Instead of the traditional 70/30 approach, this version uses the 40 and 60 levels to define a "Neutral/Caution" zone.
Key Features:
🟢 Bullish Zone (Above 60): Indicates strong upward momentum. The RSI line turns green, signaling a potential trend continuation.
🟠 Caution Zone (40–60): A neutral "no-man's land" where the market is often consolidating or undecided. The line turns orange, warning traders to be patient.
🔴 Bearish Zone (Below 40): Indicates strong downward momentum. The RSI line turns red, signaling a potential downtrend.
⚖️ Midline (50): A blue or your color choice dotted line acts as the ultimate pivot point between buyers and sellers.
🔥 Extremes (70/30): Classic Overbought (Red) and Oversold (Green) levels are included for mean-reversion context.
How to Use:
Trend Confirmation: Look for the RSI to sustain a position above 60 for longs or below 40 for shorts.
Filter Noise: Avoid entering aggressive trend trades when the RSI is stuck in the Orange Caution Zone.
Real-time Status: The dynamic label on the right provides an instant reading of the current market state and exact RSI value.
This script is a modified Relative Strength Index (RSI) designed to help traders filter out market noise by identifying three distinct momentum phases. Instead of the traditional 70/30 approach, this version uses the 40 and 60 levels to define a "Neutral/Caution" zone.
Key Features:
🟢 Bullish Zone (Above 60): Indicates strong upward momentum. The RSI line turns green, signaling a potential trend continuation.
🟠 Caution Zone (40–60): A neutral "no-man's land" where the market is often consolidating or undecided. The line turns orange, warning traders to be patient.
🔴 Bearish Zone (Below 40): Indicates strong downward momentum. The RSI line turns red, signaling a potential downtrend.
⚖️ Midline (50): A blue or your color choice dotted line acts as the ultimate pivot point between buyers and sellers.
🔥 Extremes (70/30): Classic Overbought (Red) and Oversold (Green) levels are included for mean-reversion context.
How to Use:
Trend Confirmation: Look for the RSI to sustain a position above 60 for longs or below 40 for shorts.
Filter Noise: Avoid entering aggressive trend trades when the RSI is stuck in the Orange Caution Zone.
Real-time Status: The dynamic label on the right provides an instant reading of the current market state and exact RSI value.
Mã nguồn mở
Theo đúng tinh thần TradingView, tác giả của tập lệnh này đã công bố nó dưới dạng mã nguồn mở, để các nhà giao dịch có thể xem xét và xác minh chức năng. Chúc mừng tác giả! Mặc dù bạn có thể sử dụng miễn phí, hãy nhớ rằng việc công bố lại mã phải tuân theo Nội quy.

Thông báo miễn trừ trách nhiệm
Thông tin và các ấn phẩm này không nhằm mục đích, và không cấu thành, lời khuyên hoặc khuyến nghị về tài chính, đầu tư, giao dịch hay các loại khác do TradingView cung cấp hoặc xác nhận. Đọc thêm tại Điều khoản Sử dụng.
Mã nguồn mở
Theo đúng tinh thần TradingView, tác giả của tập lệnh này đã công bố nó dưới dạng mã nguồn mở, để các nhà giao dịch có thể xem xét và xác minh chức năng. Chúc mừng tác giả! Mặc dù bạn có thể sử dụng miễn phí, hãy nhớ rằng việc công bố lại mã phải tuân theo Nội quy.
Thông báo miễn trừ trách nhiệm
Thông tin và các ấn phẩm này không nhằm mục đích, và không cấu thành, lời khuyên hoặc khuyến nghị về tài chính, đầu tư, giao dịch hay các loại khác do TradingView cung cấp hoặc xác nhận. Đọc thêm tại Điều khoản Sử dụng.