OPEN-SOURCE SCRIPT
Blue Sky (All-Time High) HUD
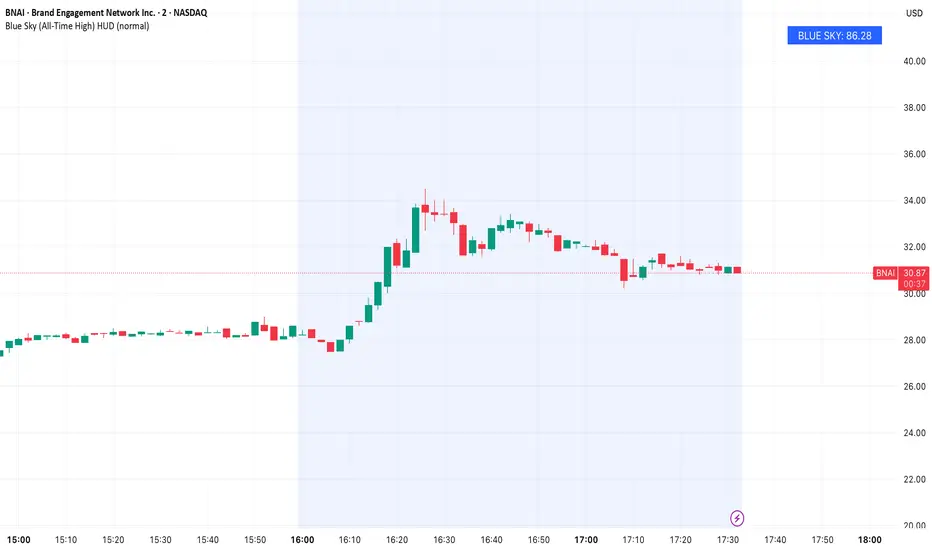
Blue Sky at a Glance
Blue Sky (All-Time High) HUD is a fixed, price-overlay indicator designed to instantly show a stock’s highest price achieved within the loaded chart history, without requiring you to zoom out or scan manually.
Instead of drawing cluttered historical markers, this script calculates the running all-time high and displays it in a clean, fixed HUD anchored to the top-right of the chart.
How It Works
The script continuously tracks the highest high reached on the chart and updates in real time as new highs are made.
The current Blue Sky value is:
Highest high observed within the loaded chart history
The value is displayed in two ways:
• A fixed HUD panel for quick visual reference
• The indicator status line for fast numerical reading
An optional horizontal line can be enabled to visualize the exact level on the chart.
How to Use It
This indicator is informational, not predictive.
Common use cases:
• Instantly see how far price is from its all-time high
• Evaluate overhead supply vs open air
• Contextualize breakouts relative to historical extremes
• Assess long-term expansion potential
Examples:
• Price approaching Blue Sky may indicate major breakout tests
• Price far below Blue Sky may signal long-term recovery room
• New highs automatically update the level in real time
Customization
You can adjust:
• Font size of the HUD display
• Optional visibility of the all-time high line
Design Philosophy
• Fixed, non-moving HUD
• No separate pane
• No repainting
• Lightweight and unobtrusive
• Built for instant context at a glance
This tool is designed for traders who want immediate awareness of a stock’s historical ceiling without disrupting price structure.
Blue Sky (All-Time High) HUD is a fixed, price-overlay indicator designed to instantly show a stock’s highest price achieved within the loaded chart history, without requiring you to zoom out or scan manually.
Instead of drawing cluttered historical markers, this script calculates the running all-time high and displays it in a clean, fixed HUD anchored to the top-right of the chart.
How It Works
The script continuously tracks the highest high reached on the chart and updates in real time as new highs are made.
The current Blue Sky value is:
Highest high observed within the loaded chart history
The value is displayed in two ways:
• A fixed HUD panel for quick visual reference
• The indicator status line for fast numerical reading
An optional horizontal line can be enabled to visualize the exact level on the chart.
How to Use It
This indicator is informational, not predictive.
Common use cases:
• Instantly see how far price is from its all-time high
• Evaluate overhead supply vs open air
• Contextualize breakouts relative to historical extremes
• Assess long-term expansion potential
Examples:
• Price approaching Blue Sky may indicate major breakout tests
• Price far below Blue Sky may signal long-term recovery room
• New highs automatically update the level in real time
Customization
You can adjust:
• Font size of the HUD display
• Optional visibility of the all-time high line
Design Philosophy
• Fixed, non-moving HUD
• No separate pane
• No repainting
• Lightweight and unobtrusive
• Built for instant context at a glance
This tool is designed for traders who want immediate awareness of a stock’s historical ceiling without disrupting price structure.
Mã nguồn mở
Theo đúng tinh thần TradingView, tác giả của tập lệnh này đã công bố nó dưới dạng mã nguồn mở, để các nhà giao dịch có thể xem xét và xác minh chức năng. Chúc mừng tác giả! Mặc dù bạn có thể sử dụng miễn phí, hãy nhớ rằng việc công bố lại mã phải tuân theo Nội quy.

Thông báo miễn trừ trách nhiệm
Thông tin và các ấn phẩm này không nhằm mục đích, và không cấu thành, lời khuyên hoặc khuyến nghị về tài chính, đầu tư, giao dịch hay các loại khác do TradingView cung cấp hoặc xác nhận. Đọc thêm tại Điều khoản Sử dụng.
Mã nguồn mở
Theo đúng tinh thần TradingView, tác giả của tập lệnh này đã công bố nó dưới dạng mã nguồn mở, để các nhà giao dịch có thể xem xét và xác minh chức năng. Chúc mừng tác giả! Mặc dù bạn có thể sử dụng miễn phí, hãy nhớ rằng việc công bố lại mã phải tuân theo Nội quy.
Thông báo miễn trừ trách nhiệm
Thông tin và các ấn phẩm này không nhằm mục đích, và không cấu thành, lời khuyên hoặc khuyến nghị về tài chính, đầu tư, giao dịch hay các loại khác do TradingView cung cấp hoặc xác nhận. Đọc thêm tại Điều khoản Sử dụng.