OPEN-SOURCE SCRIPT
Previous ATR SandFx
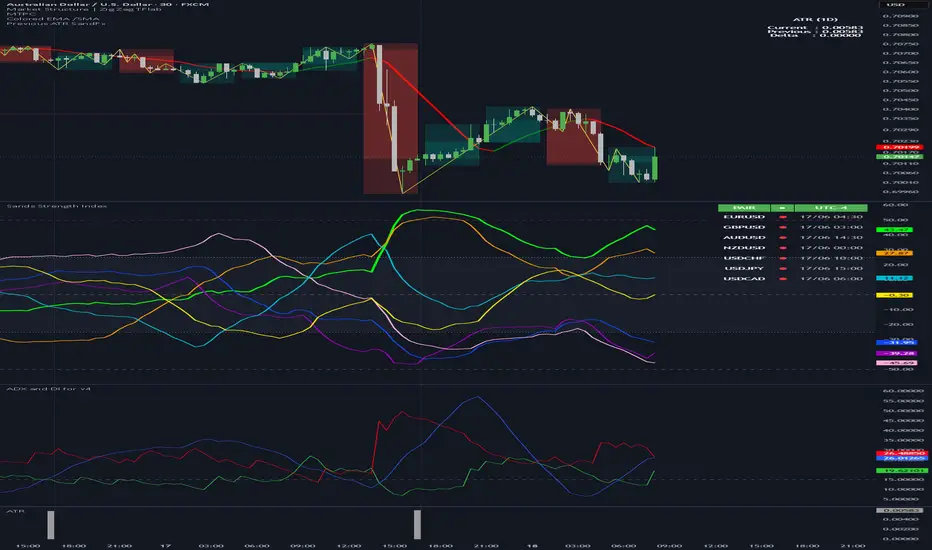
📊 Previous ATR Clean Indicator
Previous ATR Clean is a simple indicator designed to monitor market volatility changes by comparing the current candle ATR (Current ATR) with the previous candle ATR (Previous ATR). ATR (Average True Range) measures the size of price movement, not the direction of the trend. This indicator helps traders identify whether the market is experiencing volatility expansion (increasing movement) or volatility contraction (decreasing movement).
Current ATR shows the current market volatility condition. Previous ATR shows the volatility from the previous candle as a comparison. Delta ATR represents the difference between them:
Delta = Current ATR - Previous ATR
If Delta is positive (+), it means ATR is increasing → candle range is expanding → the market is gaining energy and momentum. This condition often appears during breakouts or when a trend starts developing.
If Delta is negative (-), it means ATR is decreasing → candle range is shrinking → the market is losing energy or entering a consolidation phase.
This indicator can be used to:
✅ Identify whether the market is active or slow
✅ Measure breakout strength
✅ Avoid entries during low volatility conditions
✅ Adjust stop loss and target distance based on market conditions
Example:
Current ATR: 3.50
Previous ATR: 2.80
Delta: +0.70
Meaning: volatility is increasing and the market is expanding.
Current ATR: 2.50
Previous ATR: 3.20
Delta: -0.70
Meaning: volatility is decreasing and the market is slowing down.
ATR does not provide buy or sell signals. It helps traders understand market energy and volatility conditions. Combine it with other analysis tools such as market structure, support & resistance, volume, or trend direction for better trading decisions.
Trade with volatility, not against it. 📈
Previous ATR Clean is a simple indicator designed to monitor market volatility changes by comparing the current candle ATR (Current ATR) with the previous candle ATR (Previous ATR). ATR (Average True Range) measures the size of price movement, not the direction of the trend. This indicator helps traders identify whether the market is experiencing volatility expansion (increasing movement) or volatility contraction (decreasing movement).
Current ATR shows the current market volatility condition. Previous ATR shows the volatility from the previous candle as a comparison. Delta ATR represents the difference between them:
Delta = Current ATR - Previous ATR
If Delta is positive (+), it means ATR is increasing → candle range is expanding → the market is gaining energy and momentum. This condition often appears during breakouts or when a trend starts developing.
If Delta is negative (-), it means ATR is decreasing → candle range is shrinking → the market is losing energy or entering a consolidation phase.
This indicator can be used to:
✅ Identify whether the market is active or slow
✅ Measure breakout strength
✅ Avoid entries during low volatility conditions
✅ Adjust stop loss and target distance based on market conditions
Example:
Current ATR: 3.50
Previous ATR: 2.80
Delta: +0.70
Meaning: volatility is increasing and the market is expanding.
Current ATR: 2.50
Previous ATR: 3.20
Delta: -0.70
Meaning: volatility is decreasing and the market is slowing down.
ATR does not provide buy or sell signals. It helps traders understand market energy and volatility conditions. Combine it with other analysis tools such as market structure, support & resistance, volume, or trend direction for better trading decisions.
Trade with volatility, not against it. 📈
Mã nguồn mở
Theo đúng tinh thần TradingView, tác giả của tập lệnh này đã công bố nó dưới dạng mã nguồn mở, để các nhà giao dịch có thể xem xét và xác minh chức năng. Chúc mừng tác giả! Mặc dù bạn có thể sử dụng miễn phí, hãy nhớ rằng việc công bố lại mã phải tuân theo Nội quy.

Thông báo miễn trừ trách nhiệm
Thông tin và các ấn phẩm này không nhằm mục đích, và không cấu thành, lời khuyên hoặc khuyến nghị về tài chính, đầu tư, giao dịch hay các loại khác do TradingView cung cấp hoặc xác nhận. Đọc thêm tại Điều khoản Sử dụng.
Mã nguồn mở
Theo đúng tinh thần TradingView, tác giả của tập lệnh này đã công bố nó dưới dạng mã nguồn mở, để các nhà giao dịch có thể xem xét và xác minh chức năng. Chúc mừng tác giả! Mặc dù bạn có thể sử dụng miễn phí, hãy nhớ rằng việc công bố lại mã phải tuân theo Nội quy.
Thông báo miễn trừ trách nhiệm
Thông tin và các ấn phẩm này không nhằm mục đích, và không cấu thành, lời khuyên hoặc khuyến nghị về tài chính, đầu tư, giao dịch hay các loại khác do TradingView cung cấp hoặc xác nhận. Đọc thêm tại Điều khoản Sử dụng.