OPEN-SOURCE SCRIPT
Cập nhật ML Trend Architect [TechnicalZen]
ML Trend Architect
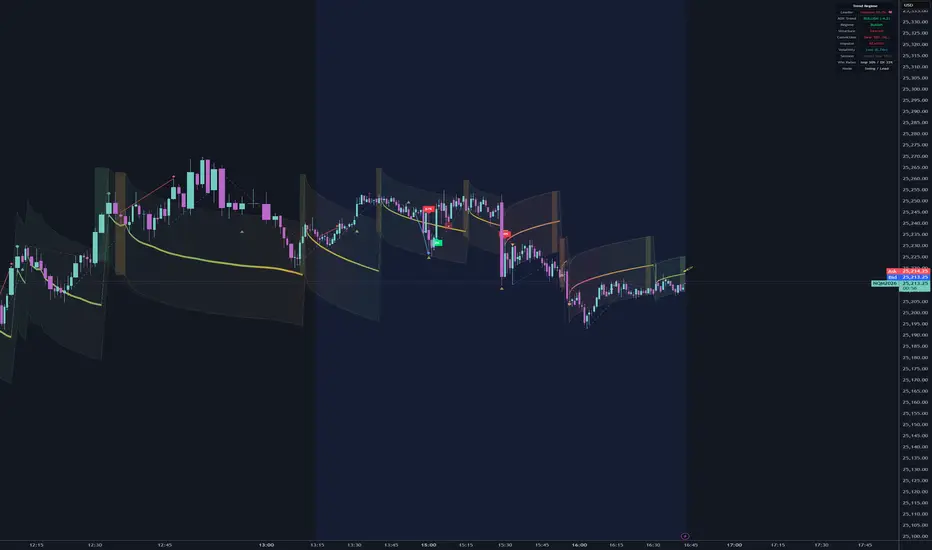
A regime visualization and forecasting engine that combines machine learning confidence scoring with curved 3D glass facades to map market structure and anticipate regime transitions in real-time.
What It Does
This indicator identifies directional regime changes using a dual-engine approach — an impulse momentum engine and a DX/ADX directional movement engine — then wraps them in curved 3D visual envelopes that show regime strength, direction, and conviction at a glance. Beyond detection, it actively forecasts regime quality by scoring each transition against historical analogs and projecting follow-through probability before the move fully develops.
How It Works
The Forecasting Pipeline
Theme Presets
Key Settings
Dashboard
The dashboard displays: Signal Leader (with win rate and direction), ADX Trend, Regime state, Structure (zone from VWMA positioning), Conviction (dominant confidence with ML/base tag), Impulse direction, Volatility regime, Session status, Win Rates, and Mode.
How to Use
Technical Notes
Disclaimer
This indicator is provided for educational and informational purposes only. It is not financial advice and should not be used as the sole basis for any trading or investment decision. Past performance of any signal, pattern, or scoring system does not guarantee future results. All trading involves risk, including the potential loss of principal. The machine learning components learn from historical data on the current instrument and timeframe — their predictions reflect pattern similarity, not certainty. The term "forecast" refers to probabilistic scoring of setup quality based on historical analogs, not a guarantee of future price direction. Always conduct your own analysis, manage your risk appropriately, and consult a qualified financial advisor before making trading decisions. The developer assumes no liability for any losses incurred through the use of this tool.
A regime visualization and forecasting engine that combines machine learning confidence scoring with curved 3D glass facades to map market structure and anticipate regime transitions in real-time.
What It Does
This indicator identifies directional regime changes using a dual-engine approach — an impulse momentum engine and a DX/ADX directional movement engine — then wraps them in curved 3D visual envelopes that show regime strength, direction, and conviction at a glance. Beyond detection, it actively forecasts regime quality by scoring each transition against historical analogs and projecting follow-through probability before the move fully develops.
How It Works
- Regime Detection
Band-break events (flips, continuations, refreshes) drive regime transitions. Price breaking above the upper band triggers a bullish flip; below the lower band triggers bearish. The system requires confirmation bars and enforces cooldowns to prevent whipsaws. - Forecasting Engine
At each regime transition, the engine evaluates how likely the new regime is to follow through before the move has played out. It scores setup quality across multiple dimensions — anchor cluster positioning, momentum alignment, compression state, duration, excursion depth, and family coherence — to produce a forward-looking conviction percentage. When KNN Memory is active, it deepens this forecast by matching the current setup fingerprint against resolved historical analogs, asking: "of all similar setups in the past, what percentage actually followed through?" The result is a probabilistic forecast — not a reactive signal — displayed as a confidence label at the moment of regime change. - Forward Resolution and Accountability
Every forecast is tracked forward over a configurable evaluation window. The system monitors whether price held on the correct side of the anchor cluster and whether it expanded sufficiently. Forecasts that fail to materialize are marked with a rejection symbol — creating a visible track record of forecast accuracy directly on the chart. This closed-loop accountability distinguishes it from indicators that fire and forget. - Curved Glass Facades
Instead of flat rectangular boxes, regime segments are rendered as curved 3D envelopes using square-root decay from the band edges. The curves start wide at segment birth and taper naturally, creating organic shapes that reflect each regime's character — steep narrow curves for aggressive moves, wide gradual sweeps for grinding trends. - DX Heat Strip
A color-gradient ribbon flows along the curved walls showing directional conviction in real-time. Yellow indicates weak/choppy conditions; cyan indicates strong bullish momentum; magenta indicates strong bearish pressure. Bulls support from below, bears press from above. - 4-Color Regime System
The regime uses a continuous gradient driven by ADX position and slope, producing four distinct states that blend smoothly:
- Teal: strong bullish momentum (ADX positive, rising)
- Orange: fading bullish momentum (ADX positive, falling)
- Light Green: fading bearish pressure (ADX negative, rising)
- Red: strong bearish pressure (ADX negative, falling) - Signal Leader Detection
The engine tracks which signal source — Impulse or DX — has been more accurate recently and who fires first. This is itself a forecast: it predicts which signal source you should weight more heavily in the current market regime. The dashboard displays the current leader with win rate and directional bias. - Connection Lines
Dashed lines connect same-direction hull phases across interruptions, drawing on highs (bear color) and lows (bull color). When the price connection slope diverges from the indicator slope, lines become solid and thicken — flagging potential divergence setups that often precede regime reversals.
The Forecasting Pipeline
- Step 1: Context Assessment — Where is price relative to the 7-anchor cluster? Are anchors aligned (coherent) or scattered? Is the market compressed or extended?
- Step 2: Trigger Quality — How decisive is the breakout bar? Body ratio, close location, force spread, and cluster clearance are scored.
- Step 3: Regime Environment — ADX strength, relative volume, and ATR regime provide the macro backdrop.
- Step 4: Analog Matching (KNN) — The current feature fingerprint is compared to historical setups. Nearest neighbors are found using normalized Manhattan distance across 5 feature dimensions. Their resolved outcomes (success/failure) are distance-weighted to produce a probability.
- Step 5: Blended Forecast — Base score and KNN probability are blended (configurable weight) into a final conviction percentage.
- Step 6: Forward Tracking — The forecast is monitored over the evaluation window. Hold ratio and expansion targets determine success or failure.
- Step 7: Memory Update — Resolved outcomes feed back into the KNN memory bank, continuously improving forecast accuracy on the current instrument.
Theme Presets
- Curved — Full curved glass facades with 3D depth, regime fills, and heat strip
- Classic — Clean curved envelopes without 3D effects
- Heat Strip — Minimal view showing only the DX heat ribbon, markers, and connection lines
- Custom — Full manual control over all visual parameters
Key Settings
- My Trade Style — Balanced (standard width), Conservative (wider bands), or Aggressive (tighter bands)
- Regime Mode — Swing (4-color ADX gradient) or Scalp (2-state impulse-driven)
- Mid Line View — Lead (mid sits opposite price as support/resistance) or Follow (mid tracks toward price)
- KNN Memory — Enable adaptive learning from historical pattern outcomes
- Confidence Threshold — Minimum confidence % required to display a forecast label
- Theme Preset — Quick visual style switching
Dashboard
The dashboard displays: Signal Leader (with win rate and direction), ADX Trend, Regime state, Structure (zone from VWMA positioning), Conviction (dominant confidence with ML/base tag), Impulse direction, Volatility regime, Session status, Win Rates, and Mode.
How to Use
- Watch the regime color for the macro direction — teal and orange are bullish states, green and red are bearish
- Read the heat strip color for conviction strength — vivid colors mean strong directional movement, yellow means caution
- Follow the connection lines for structural trend tracking — solid thick lines with diamonds flag divergence between price and momentum
- Trust confidence labels above your threshold — higher % means the forecast matches historically successful patterns
- Respect rejection markers (x) — they mark where a forecast failed to materialize
- Check the Leader in the dashboard — trade with the signal source that has been more reliable recently
- Enable KNN Memory for instruments you trade regularly — it improves forecast accuracy as it accumulates resolved outcomes
Technical Notes
- Works on any instrument and timeframe
- No repainting — all signals confirm on bar close
- KNN memory is session-scoped and builds over time on the current instrument
- 3D rendering uses polylines (max 100) with configurable segment count
- Confidence scoring uses a 7-anchor cluster consensus, not a single indicator
- Forecasts are forward-resolved with visible accountability — every prediction is tracked and scored
Disclaimer
This indicator is provided for educational and informational purposes only. It is not financial advice and should not be used as the sole basis for any trading or investment decision. Past performance of any signal, pattern, or scoring system does not guarantee future results. All trading involves risk, including the potential loss of principal. The machine learning components learn from historical data on the current instrument and timeframe — their predictions reflect pattern similarity, not certainty. The term "forecast" refers to probabilistic scoring of setup quality based on historical analogs, not a guarantee of future price direction. Always conduct your own analysis, manage your risk appropriately, and consult a qualified financial advisor before making trading decisions. The developer assumes no liability for any losses incurred through the use of this tool.
Phát hành các Ghi chú
Improved Dashboard responsiveness. Phát hành các Ghi chú
Improved directional clarity. Phát hành các Ghi chú
Enable Kalman Filter based Regime smoothing. Phát hành các Ghi chú
Updates: 1) Continuous Heat Strip.
2) Continuous Glass Ribbon.
3) Improved Aggressive and Conservative Style regimes.
4) Improved visuals.
Phát hành các Ghi chú
Intuitive UXConcave side of the walls always face the user.
Mã nguồn mở
Theo đúng tinh thần TradingView, tác giả của tập lệnh này đã công bố nó dưới dạng mã nguồn mở, để các nhà giao dịch có thể xem xét và xác minh chức năng. Chúc mừng tác giả! Mặc dù bạn có thể sử dụng miễn phí, hãy nhớ rằng việc công bố lại mã phải tuân theo Nội quy.

Thông báo miễn trừ trách nhiệm
Thông tin và các ấn phẩm này không nhằm mục đích, và không cấu thành, lời khuyên hoặc khuyến nghị về tài chính, đầu tư, giao dịch hay các loại khác do TradingView cung cấp hoặc xác nhận. Đọc thêm tại Điều khoản Sử dụng.
Mã nguồn mở
Theo đúng tinh thần TradingView, tác giả của tập lệnh này đã công bố nó dưới dạng mã nguồn mở, để các nhà giao dịch có thể xem xét và xác minh chức năng. Chúc mừng tác giả! Mặc dù bạn có thể sử dụng miễn phí, hãy nhớ rằng việc công bố lại mã phải tuân theo Nội quy.
Thông báo miễn trừ trách nhiệm
Thông tin và các ấn phẩm này không nhằm mục đích, và không cấu thành, lời khuyên hoặc khuyến nghị về tài chính, đầu tư, giao dịch hay các loại khác do TradingView cung cấp hoặc xác nhận. Đọc thêm tại Điều khoản Sử dụng.