OPEN-SOURCE SCRIPT
Liquidity Propulsion Signals | ProjectSyndicate
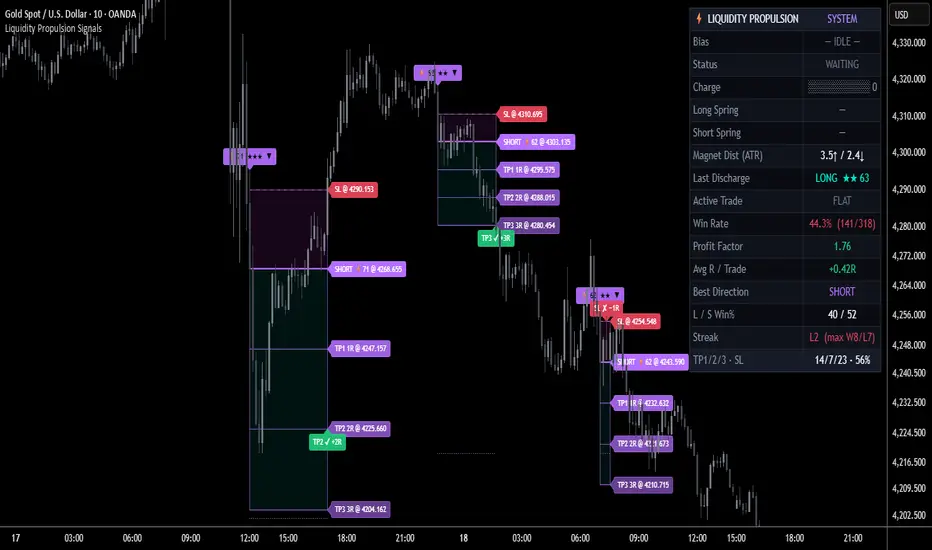
Liquidity Propulsion Signals catches the moment a liquidity grab fails — and instead of chasing the breakout, it fades it. Markets coil, then hunt the resting liquidity parked above swing highs and below swing lows. When price spears one of those pools and then snaps back inside the range, it traps the breakout crowd and loads a "spring." The engine measures the energy stored in that failed grab as a 0–100 Propulsion Charge, and fires contrarian — in the direction the trapped crowd is now forced to unwind. Every setup gets a structural invalidation level beyond the failed grab, fixed R-based targets, a 0–100 charge with a 1–5 star rank, and is tracked live on a full statistics dashboard — including honest stop-outs — so you can see exactly how the logic behaves on the symbol and timeframe you trade.
🧠 Liquidity-Spring Core — the core idea, expressed as a lifecycle: COIL ▸ GRAB ▸ LOAD ▸ IGNITE ▸ TARGET. Resting-liquidity pools are mapped from confirmed swing pivots — the highs and lows where stops cluster. A grab begins when price pierces one of those pools: a low driven below sell-side liquidity, or a high pushed above buy-side liquidity. If price then reclaims the pool — closes back inside the range within the reclaim window — the grab has failed, and that failure loads a spring on the opposite side. The spring later ignites into a signal when price pushes through the bar that armed it. Pools come from confirmed pivots and every transition is evaluated on the bar's close, so the pools and the signal do not repaint.
🔋 Charge Anatomy — a failed grab is not just true or false; it is scored for how much energy it carries. The Propulsion Charge fuses six breakout-native ingredients into a single 0–100 read: grab depth (how far price penetrated the pool, in ATR), reclaim velocity (how fast it snapped back within the window), rejection wick (the share of the bar spent rejecting the level), volume surge (the spike over a rolling baseline), coil compression (how tightly the market was wound before the grab — a loaded spring versus a loose one), and reclaim displacement (how decisively close pushed back past the level). Each component is independently weighted, so you can dial the engine toward depth, speed, volume, or compression as your edge demands.
🎯 Structural Invalidation + R-Based Targets — a loaded spring is invalidated before it fires if price falls back beyond the grab extreme, so weak grabs quietly disarm instead of trading. Once a discharge fires, the trade model builds a universal ATR-based zone height: the stop sits a fixed ATR distance from entry, so every signal draws the same SL/TP geometry — no super-wide or super-narrow zones to distort your risk. TP1, TP2, and TP3 are set at clean R multiples, defaulting to a balanced 1R / 2R / 3R and fully adjustable to your reward profile. Every signal plots its complete Entry / SL / TP1 / TP2 / TP3 line set, labeled level prices, and filled TP / SL zone boxes, with a result label on exit.
🧲 Opposing-Liquidity Magnet — because a discharge is fundamentally drawn toward the next pool of unswept liquidity, the engine can project the nearest opposing pool as a dotted magnet line: the obvious, structural target the move is being pulled toward. It is a context read for where the propulsion wants to go, sitting alongside your fixed R targets rather than replacing them.
🎚️ Conviction Controls — a compact set of dials sets how serious a failed grab must be before it counts: the Arm Threshold (the minimum charge that loads a spring at all), a Strong Tier cutoff, an optional Only Fire Strong-Tier Springs filter, the minimum grab depth, the reclaim window, and the ignition window that keeps an armed spring from waiting forever. Tighten them for fewer, cleaner discharges; loosen them for more activity. Combined with the six component weights, this is your main control over conviction versus frequency.
🧭 Ignition Gating & Single-Ticket Discipline — an armed spring is not a trade until it ignites: price must close through the ignition level set at load time. If the grab extreme is broken back the other way, the spring disarms; if the ignition window elapses with no trigger, it discharges unused and resets. Only one ticket is active at a time, so a single chaotic session can't stack overlapping trades, and resolution is SL-first pessimistic with honest partial-TP accounting — if a stop is hit after TP1 or TP2, that partial result is booked rather than rounded up.
⭐ 0–100 Charge with Star Tiers — every discharge is labeled with its numeric charge, a 1–5 star rank, and a tier ladder running FLAT → WEAK → PRIMED → STRONG → ELITE. Treat the charge as a cleanliness and confluence read for ranking and thinning setups — it describes how textbook a failed grab is, not a guaranteed outcome. The Arm Threshold and Only-Strong gate restrict what is displayed and alerted, while the dashboard keeps tracking every tier in the background.
📊 Live Statistics Dashboard — a non-intrusive panel tracks, in real time on your chart: the current bias (long spring / short spring / active / idle) and status (waiting → grab forming → spring loaded → discharging), a live charge meter with separate long- and short-spring readings, the magnet distance up and down in ATR, the last discharge with its star score, total signals, win rate, closed trades, profit factor, average R per trade, best-performing direction, long vs short win rate, current and max win/loss streaks, and a TP1 / TP2 / TP3 / SL outcome breakdown. Every filled trade that reaches an outcome is counted — winners and stop-outs alike — so the numbers are computed live from the real signals on your current symbol and timeframe, not a figure printed in a description.
🎨 Clean Themed Visuals — five coherent palettes (Midnight default, plus Emerald, Ice Blue, Gold Black, and Aqua Violet) shade the liquidity-pool lines, the ⚡ charge labels, the per-trade SL / TP ladder and zone boxes, and the dashboard to one look, so direction and quality read at a glance. Liquidity pools are drawn as color-keyed dotted levels; each discharge prints a ⚡ label with its charge, star tier, and direction arrow. The active ticket extends live to the right and then snaps cleanly back to its exit bar on close, so labels never float away — and a max-drawn-trades cap keeps only the most recent tickets on the chart while the statistics stay cumulative over the full history.
🔔 Detailed Alerts — fires on a long or short spring loaded (a qualifying failed grab), on long / short discharge (ignition), on any discharge, and on TP3 and SL events, formatted for manual or automated use. The strength gate can restrict alerts to higher-conviction springs.
🔧 Fully Customizable — every component is exposed: the pivot length that defines which pools count, the ATR length, the coil window and its looseness reference; the reclaim window, minimum grab depth, depth and volume energy references, volume baseline, and ignition window; the arm and strong thresholds, the only-strong filter, and all six charge weights; the universal risk distance and the three R targets; the opposing-liquidity magnet, level-shelf length, and max historical trades; the dashboard position, size, meter, and per-target breakdown; all five themes; and every pool, label, line, box, and star toggle.
🎯 Why this is different — most "liquidity" tools simply draw lines at old highs and lows and tell you a sweep happened. This one treats the failed sweep as the event, scores how much spring energy that failure stored across depth, velocity, wick, volume, compression, and displacement, and fires contrarian — fading the trapped breakout the way price actually tends to unwind — then anchors invalidation to the grab itself, projects the opposing pool the move is drawn toward, and layers an objective 0–100 ranking and a live, honest statistics panel that counts stop-outs in full. You tune and judge it on real, current data from your own chart instead of a marketing number.
🚀 Where to use it — the engine is symbol-agnostic and built on universal behavior: stop-runs and failed breakouts happen in every liquid market, so it can be applied to FX majors and crosses, metals, indices, and crypto, on intraday timeframes. Pivot length and the ATR-based stop adapt to each instrument's volatility automatically. Because it is a contrarian, mean-reversion engine, it shines in ranging and liquidity-hunting conditions and demands more care in strong one-way trends — let the dashboard tell you whether the logic suits the pair and timeframe before you commit.
🎯 How to trade it
Apply it to a liquid symbol on an intraday timeframe and let the dashboard populate. Read the live win rate, profit factor, and average R for your symbol and timeframe first — if the logic doesn't suit that market, you'll see it.
Wait for a ⚡ LONG / ⚡ SHORT discharge label — it marks a confirmed close through the ignition level after a failed grab, with the charge, star tier, and full Entry / SL / TP1 / TP2 / TP3 already plotted.
Use the opposing-liquidity magnet as a logical target read: it shows the unswept pool the discharge is being pulled toward.
Manage the trade with the plotted levels — the universal ATR stop defines your risk and TP1/2/3 sit at your chosen R multiples. Bank or trail however suits your style.
Use the Arm Threshold, Only-Strong gate, and the six charge weights to set your tempo — stricter for fewer, cleaner discharges; looser for more activity — and lean on the star tier to focus on the most textbook failed grabs.
⚠️ Important — this is a decision-support tool, not a standalone buy/sell system, and it makes no performance guarantees. Default settings were chosen on historical data and behavior will vary by symbol, timeframe, session, and configuration; the dashboard's statistics are historical and descriptive, not a forecast. The trade model resolves stop-first and books partial-target exits honestly, so some trades close for a fraction of a target rather than a full win or loss — these are counted in full, which is honest but means win rate alone is misleading; always weigh it together with average R and profit factor, and resize the R targets to your own risk profile. Signals confirm on the closed bar, so always wait for the labeled discharge on a closed candle. Because the system is contrarian by design, a sufficiently strong trend can run straight through a stop — combine it with your own analysis and risk management, and test it on your market before trading it live.
🧠 Liquidity-Spring Core — the core idea, expressed as a lifecycle: COIL ▸ GRAB ▸ LOAD ▸ IGNITE ▸ TARGET. Resting-liquidity pools are mapped from confirmed swing pivots — the highs and lows where stops cluster. A grab begins when price pierces one of those pools: a low driven below sell-side liquidity, or a high pushed above buy-side liquidity. If price then reclaims the pool — closes back inside the range within the reclaim window — the grab has failed, and that failure loads a spring on the opposite side. The spring later ignites into a signal when price pushes through the bar that armed it. Pools come from confirmed pivots and every transition is evaluated on the bar's close, so the pools and the signal do not repaint.
🔋 Charge Anatomy — a failed grab is not just true or false; it is scored for how much energy it carries. The Propulsion Charge fuses six breakout-native ingredients into a single 0–100 read: grab depth (how far price penetrated the pool, in ATR), reclaim velocity (how fast it snapped back within the window), rejection wick (the share of the bar spent rejecting the level), volume surge (the spike over a rolling baseline), coil compression (how tightly the market was wound before the grab — a loaded spring versus a loose one), and reclaim displacement (how decisively close pushed back past the level). Each component is independently weighted, so you can dial the engine toward depth, speed, volume, or compression as your edge demands.
🎯 Structural Invalidation + R-Based Targets — a loaded spring is invalidated before it fires if price falls back beyond the grab extreme, so weak grabs quietly disarm instead of trading. Once a discharge fires, the trade model builds a universal ATR-based zone height: the stop sits a fixed ATR distance from entry, so every signal draws the same SL/TP geometry — no super-wide or super-narrow zones to distort your risk. TP1, TP2, and TP3 are set at clean R multiples, defaulting to a balanced 1R / 2R / 3R and fully adjustable to your reward profile. Every signal plots its complete Entry / SL / TP1 / TP2 / TP3 line set, labeled level prices, and filled TP / SL zone boxes, with a result label on exit.
🧲 Opposing-Liquidity Magnet — because a discharge is fundamentally drawn toward the next pool of unswept liquidity, the engine can project the nearest opposing pool as a dotted magnet line: the obvious, structural target the move is being pulled toward. It is a context read for where the propulsion wants to go, sitting alongside your fixed R targets rather than replacing them.
🎚️ Conviction Controls — a compact set of dials sets how serious a failed grab must be before it counts: the Arm Threshold (the minimum charge that loads a spring at all), a Strong Tier cutoff, an optional Only Fire Strong-Tier Springs filter, the minimum grab depth, the reclaim window, and the ignition window that keeps an armed spring from waiting forever. Tighten them for fewer, cleaner discharges; loosen them for more activity. Combined with the six component weights, this is your main control over conviction versus frequency.
🧭 Ignition Gating & Single-Ticket Discipline — an armed spring is not a trade until it ignites: price must close through the ignition level set at load time. If the grab extreme is broken back the other way, the spring disarms; if the ignition window elapses with no trigger, it discharges unused and resets. Only one ticket is active at a time, so a single chaotic session can't stack overlapping trades, and resolution is SL-first pessimistic with honest partial-TP accounting — if a stop is hit after TP1 or TP2, that partial result is booked rather than rounded up.
⭐ 0–100 Charge with Star Tiers — every discharge is labeled with its numeric charge, a 1–5 star rank, and a tier ladder running FLAT → WEAK → PRIMED → STRONG → ELITE. Treat the charge as a cleanliness and confluence read for ranking and thinning setups — it describes how textbook a failed grab is, not a guaranteed outcome. The Arm Threshold and Only-Strong gate restrict what is displayed and alerted, while the dashboard keeps tracking every tier in the background.
📊 Live Statistics Dashboard — a non-intrusive panel tracks, in real time on your chart: the current bias (long spring / short spring / active / idle) and status (waiting → grab forming → spring loaded → discharging), a live charge meter with separate long- and short-spring readings, the magnet distance up and down in ATR, the last discharge with its star score, total signals, win rate, closed trades, profit factor, average R per trade, best-performing direction, long vs short win rate, current and max win/loss streaks, and a TP1 / TP2 / TP3 / SL outcome breakdown. Every filled trade that reaches an outcome is counted — winners and stop-outs alike — so the numbers are computed live from the real signals on your current symbol and timeframe, not a figure printed in a description.
🎨 Clean Themed Visuals — five coherent palettes (Midnight default, plus Emerald, Ice Blue, Gold Black, and Aqua Violet) shade the liquidity-pool lines, the ⚡ charge labels, the per-trade SL / TP ladder and zone boxes, and the dashboard to one look, so direction and quality read at a glance. Liquidity pools are drawn as color-keyed dotted levels; each discharge prints a ⚡ label with its charge, star tier, and direction arrow. The active ticket extends live to the right and then snaps cleanly back to its exit bar on close, so labels never float away — and a max-drawn-trades cap keeps only the most recent tickets on the chart while the statistics stay cumulative over the full history.
🔔 Detailed Alerts — fires on a long or short spring loaded (a qualifying failed grab), on long / short discharge (ignition), on any discharge, and on TP3 and SL events, formatted for manual or automated use. The strength gate can restrict alerts to higher-conviction springs.
🔧 Fully Customizable — every component is exposed: the pivot length that defines which pools count, the ATR length, the coil window and its looseness reference; the reclaim window, minimum grab depth, depth and volume energy references, volume baseline, and ignition window; the arm and strong thresholds, the only-strong filter, and all six charge weights; the universal risk distance and the three R targets; the opposing-liquidity magnet, level-shelf length, and max historical trades; the dashboard position, size, meter, and per-target breakdown; all five themes; and every pool, label, line, box, and star toggle.
🎯 Why this is different — most "liquidity" tools simply draw lines at old highs and lows and tell you a sweep happened. This one treats the failed sweep as the event, scores how much spring energy that failure stored across depth, velocity, wick, volume, compression, and displacement, and fires contrarian — fading the trapped breakout the way price actually tends to unwind — then anchors invalidation to the grab itself, projects the opposing pool the move is drawn toward, and layers an objective 0–100 ranking and a live, honest statistics panel that counts stop-outs in full. You tune and judge it on real, current data from your own chart instead of a marketing number.
🚀 Where to use it — the engine is symbol-agnostic and built on universal behavior: stop-runs and failed breakouts happen in every liquid market, so it can be applied to FX majors and crosses, metals, indices, and crypto, on intraday timeframes. Pivot length and the ATR-based stop adapt to each instrument's volatility automatically. Because it is a contrarian, mean-reversion engine, it shines in ranging and liquidity-hunting conditions and demands more care in strong one-way trends — let the dashboard tell you whether the logic suits the pair and timeframe before you commit.
🎯 How to trade it
Apply it to a liquid symbol on an intraday timeframe and let the dashboard populate. Read the live win rate, profit factor, and average R for your symbol and timeframe first — if the logic doesn't suit that market, you'll see it.
Wait for a ⚡ LONG / ⚡ SHORT discharge label — it marks a confirmed close through the ignition level after a failed grab, with the charge, star tier, and full Entry / SL / TP1 / TP2 / TP3 already plotted.
Use the opposing-liquidity magnet as a logical target read: it shows the unswept pool the discharge is being pulled toward.
Manage the trade with the plotted levels — the universal ATR stop defines your risk and TP1/2/3 sit at your chosen R multiples. Bank or trail however suits your style.
Use the Arm Threshold, Only-Strong gate, and the six charge weights to set your tempo — stricter for fewer, cleaner discharges; looser for more activity — and lean on the star tier to focus on the most textbook failed grabs.
⚠️ Important — this is a decision-support tool, not a standalone buy/sell system, and it makes no performance guarantees. Default settings were chosen on historical data and behavior will vary by symbol, timeframe, session, and configuration; the dashboard's statistics are historical and descriptive, not a forecast. The trade model resolves stop-first and books partial-target exits honestly, so some trades close for a fraction of a target rather than a full win or loss — these are counted in full, which is honest but means win rate alone is misleading; always weigh it together with average R and profit factor, and resize the R targets to your own risk profile. Signals confirm on the closed bar, so always wait for the labeled discharge on a closed candle. Because the system is contrarian by design, a sufficiently strong trend can run straight through a stop — combine it with your own analysis and risk management, and test it on your market before trading it live.
Mã nguồn mở
Theo đúng tinh thần TradingView, tác giả của tập lệnh này đã công bố nó dưới dạng mã nguồn mở, để các nhà giao dịch có thể xem xét và xác minh chức năng. Chúc mừng tác giả! Mặc dù bạn có thể sử dụng miễn phí, hãy nhớ rằng việc công bố lại mã phải tuân theo Nội quy.

syndicate001.com
Algo systems for prop traders
Algo systems for pro gold traders
Algo Trading and Indicator Tutorials
Levels desk Gold FX NQ ES JPN225
telegram.me/aisyndicate001
Algo systems for prop traders
Algo systems for pro gold traders
Algo Trading and Indicator Tutorials
Levels desk Gold FX NQ ES JPN225
telegram.me/aisyndicate001
Thông báo miễn trừ trách nhiệm
Thông tin và các ấn phẩm này không nhằm mục đích, và không cấu thành, lời khuyên hoặc khuyến nghị về tài chính, đầu tư, giao dịch hay các loại khác do TradingView cung cấp hoặc xác nhận. Đọc thêm tại Điều khoản Sử dụng.
Mã nguồn mở
Theo đúng tinh thần TradingView, tác giả của tập lệnh này đã công bố nó dưới dạng mã nguồn mở, để các nhà giao dịch có thể xem xét và xác minh chức năng. Chúc mừng tác giả! Mặc dù bạn có thể sử dụng miễn phí, hãy nhớ rằng việc công bố lại mã phải tuân theo Nội quy.
syndicate001.com
Algo systems for prop traders
Algo systems for pro gold traders
Algo Trading and Indicator Tutorials
Levels desk Gold FX NQ ES JPN225
telegram.me/aisyndicate001
Algo systems for prop traders
Algo systems for pro gold traders
Algo Trading and Indicator Tutorials
Levels desk Gold FX NQ ES JPN225
telegram.me/aisyndicate001
Thông báo miễn trừ trách nhiệm
Thông tin và các ấn phẩm này không nhằm mục đích, và không cấu thành, lời khuyên hoặc khuyến nghị về tài chính, đầu tư, giao dịch hay các loại khác do TradingView cung cấp hoặc xác nhận. Đọc thêm tại Điều khoản Sử dụng.