OPEN-SOURCE SCRIPT
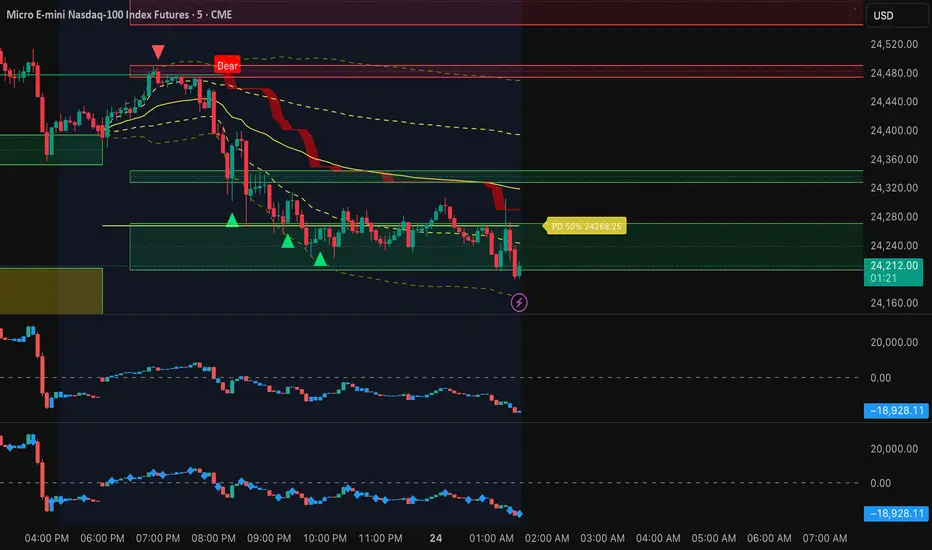
CVD Candles.
█ WHAT IS CVD?
Cumulative Volume Delta (CVD) tracks the running total of buying volume minus selling volume. It reveals who's in control — buyers or sellers — beyond what price alone shows.
█ HOW IT WORKS
Each candle represents the cumulative delta:
• Delta = Buy Volume − Sell Volume
• CVD = Running sum of delta
This creates a "price chart" of order flow, making it easy to spot divergences between price and actual buying/selling pressure.
█ 3-COLOR SYSTEM
🟢 GREEN — Strong Bullish
Price closed above previous bar's high. Buyers in control.
🔴 RED — Strong Bearish
Price closed below previous bar's low. Sellers in control.
🔵 BLUE — Neutral (Reversal Signal)
Price closed between previous high/low. Momentum pausing — watch for potential reversal.
█ HOW TO USE
1. TREND CONFIRMATION
Price up + CVD up (green) = Strong trend ✓
Price up + CVD down (red) = Weak trend, possible reversal
2. DIVERGENCE
Price making new highs but CVD declining = Bearish divergence
Price making new lows but CVD rising = Bullish divergence
3. REVERSAL SIGNALS
Blue candles indicate momentum pause — often precede reversals
█ SETTINGS
• Reset Daily: Resets CVD at each session start
• Works best on futures, stocks, and crypto with volume data
█ CREDITS
Inspired by Bookmap's Cumulative Delta indicator.
Cumulative Volume Delta (CVD) tracks the running total of buying volume minus selling volume. It reveals who's in control — buyers or sellers — beyond what price alone shows.
█ HOW IT WORKS
Each candle represents the cumulative delta:
• Delta = Buy Volume − Sell Volume
• CVD = Running sum of delta
This creates a "price chart" of order flow, making it easy to spot divergences between price and actual buying/selling pressure.
█ 3-COLOR SYSTEM
🟢 GREEN — Strong Bullish
Price closed above previous bar's high. Buyers in control.
🔴 RED — Strong Bearish
Price closed below previous bar's low. Sellers in control.
🔵 BLUE — Neutral (Reversal Signal)
Price closed between previous high/low. Momentum pausing — watch for potential reversal.
█ HOW TO USE
1. TREND CONFIRMATION
Price up + CVD up (green) = Strong trend ✓
Price up + CVD down (red) = Weak trend, possible reversal
2. DIVERGENCE
Price making new highs but CVD declining = Bearish divergence
Price making new lows but CVD rising = Bullish divergence
3. REVERSAL SIGNALS
Blue candles indicate momentum pause — often precede reversals
█ SETTINGS
• Reset Daily: Resets CVD at each session start
• Works best on futures, stocks, and crypto with volume data
█ CREDITS
Inspired by Bookmap's Cumulative Delta indicator.
Mã nguồn mở
Theo đúng tinh thần TradingView, tác giả của tập lệnh này đã công bố nó dưới dạng mã nguồn mở, để các nhà giao dịch có thể xem xét và xác minh chức năng. Chúc mừng tác giả! Mặc dù bạn có thể sử dụng miễn phí, hãy nhớ rằng việc công bố lại mã phải tuân theo Nội quy.

Thông báo miễn trừ trách nhiệm
Thông tin và các ấn phẩm này không nhằm mục đích, và không cấu thành, lời khuyên hoặc khuyến nghị về tài chính, đầu tư, giao dịch hay các loại khác do TradingView cung cấp hoặc xác nhận. Đọc thêm tại Điều khoản Sử dụng.
Mã nguồn mở
Theo đúng tinh thần TradingView, tác giả của tập lệnh này đã công bố nó dưới dạng mã nguồn mở, để các nhà giao dịch có thể xem xét và xác minh chức năng. Chúc mừng tác giả! Mặc dù bạn có thể sử dụng miễn phí, hãy nhớ rằng việc công bố lại mã phải tuân theo Nội quy.
Thông báo miễn trừ trách nhiệm
Thông tin và các ấn phẩm này không nhằm mục đích, và không cấu thành, lời khuyên hoặc khuyến nghị về tài chính, đầu tư, giao dịch hay các loại khác do TradingView cung cấp hoặc xác nhận. Đọc thêm tại Điều khoản Sử dụng.