Polynomial Regression Channel [SMRT Algo]
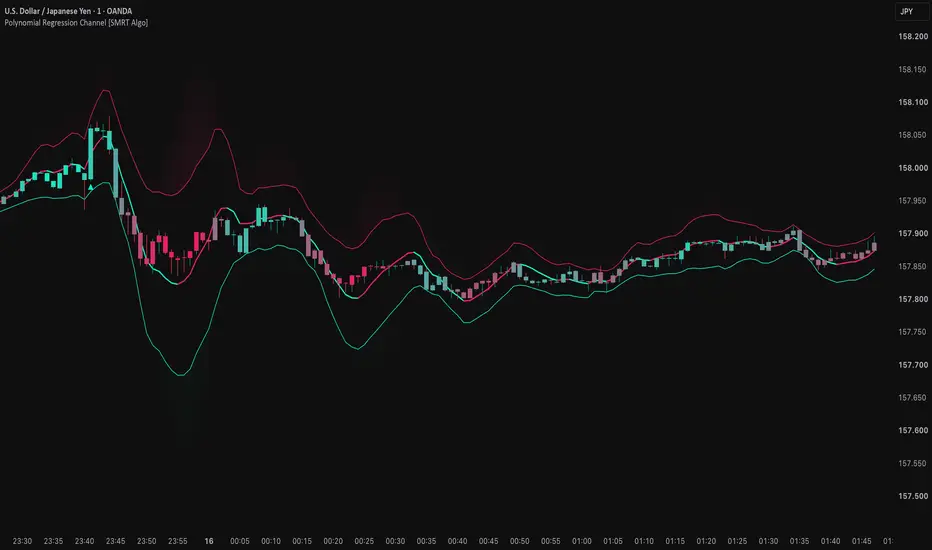
Polynomial Regression Channel [SMRT Algo] is a free, open-source chart overlay that combines a rolling polynomial regression centerline, two channel-width measures, momentum-based candle colors, and two-candle reversal markers.
The centerline provides a fitted price reference, the bands show how price is positioned around that reference, and the candle gradient adds momentum context. Reversal markers highlight specific candle patterns after an excursion beyond a deviation band. Each component answers a different question without requiring a separate indicator pane.

Key Features
1. The Regression Centerline
On each bar, the indicator fits a polynomial to a window of closing prices and plots the fitted value at that window's most recent endpoint. The connected endpoint values form the centerline you see on the chart.
Even Degree 1 can produce a bending plotted centerline because the fitted endpoint is recalculated as the window advances. The indicator does not project the fitted curve into future bars.
The default Lookback Period of 20 uses 21 closing prices, including both endpoints. Starting Bar Offset moves the regression's source window into the past; it does not move the plotted line backward on the chart.
2. Understanding the Channel
Both band systems are centered on the regression endpoint and scaled by Band Multiplier.
Deviation Bands
The upper and lower deviation bands use the standard deviation of the latest Lookback Period + 1 closing prices. They provide a reference for recent price dispersion around the regression centerline.
Regression Bands
The layer labeled Regression Bands uses a custom root-mean-square calculation that compares historical closes with regression endpoints from successively shifted historical windows. This is not the conventional residual standard deviation of one fitted polynomial. These boundaries are transparent and are primarily represented through the shaded regions between the two band systems.
Neither band system is a statistical confidence interval. The deviation bands are not necessarily the outermost boundaries, and a band touch does not establish that price must reverse. Starting Bar Offset affects the regression calculations, while the price-deviation width continues to use the latest closes.
3. Centerline Color and Candle Momentum
The centerline color uses its one-bar change normalized by 0.1 × ATR(14), with Trend Sensitivity defining the neutral threshold. In this version, the mapping is inverse: a sufficiently falling centerline uses the selected bullish color, a sufficiently rising centerline uses the bearish color, and values within the threshold use the neutral color.
Candle coloring uses a separate calculation: the change in the centerline over Momentum Period, divided by ATR(14), scaled by Gradient Sensitivity, and limited to a range of −1 to +1.
Higher Gradient Sensitivity values require a larger ATR-normalized move to reach full color intensity. Candle colors describe regression momentum and can differ from each candle's actual open-to-close direction.
4. Two-Candle Reversal Markers
The markers use the deviation bands and actual candle prices—not the momentum colors or centerline color.
The first candle only needs to trade beyond its band; it does not need to close beyond it. The second candle does not have to close back inside the channel, engulf the previous candle, or break its high or low. Doji candles do not satisfy the required directional conditions.

In this example, a bearish marker is followed by a brief decline and then a rise. The annotation demonstrates the pattern's conditions rather than a guaranteed change in direction. Read each candle's open and close when checking the rule, because momentum coloring can obscure its usual bullish or bearish appearance.
Settings Guide
Calculation Behavior and Limitations
The indicator uses the current chart's price data without higher-timeframe requests or future-bar references. It plots a rolling endpoint series rather than redrawing one newly fitted curve across earlier candles.
Values on the open bar can change as price updates. A reversal marker may appear or disappear before that bar closes, so evaluate completed patterns after the close. Changes to settings or the underlying price data can also alter historical results.
Higher polynomial degrees can react strongly to local price changes. The custom regression-band calculation requires additional historical data and can become computationally expensive at long lookbacks. Allow sufficient history for the selected window and offset.
This is an analytical indicator, not a trading strategy. It includes no built-in alert conditions, automated orders, stop-loss or take-profit rules, or performance backtest.
Free and open source for inspection and learning. The model describes historical price behavior; it does not guarantee future direction or trading results.
The centerline provides a fitted price reference, the bands show how price is positioned around that reference, and the candle gradient adds momentum context. Reversal markers highlight specific candle patterns after an excursion beyond a deviation band. Each component answers a different question without requiring a separate indicator pane.
Key Features
- Rolling polynomial regression: Choose linear, quadratic, or cubic fitting to adjust the model's flexibility.
- Two channel measures: Compare closing-price dispersion with a custom RMS measure built from historical closes and shifted regression estimates.
- Momentum candle gradient: Visualize changes in the regression centerline relative to ATR.
- Two-candle reversal markers: Identify an opposite-direction candle following a qualifying band excursion.
- Flexible presentation: Configure the centerline, band layers, candle coloring, markers, and color palette.
1. The Regression Centerline
On each bar, the indicator fits a polynomial to a window of closing prices and plots the fitted value at that window's most recent endpoint. The connected endpoint values form the centerline you see on the chart.
- Degree 1 — Linear: Fits a straight-line model within each calculation window.
- Degree 2 — Quadratic: Allows curvature within the fitted model.
- Degree 3 — Cubic: Allows more complex curvature and can respond more sharply to local price changes.
Even Degree 1 can produce a bending plotted centerline because the fitted endpoint is recalculated as the window advances. The indicator does not project the fitted curve into future bars.
The default Lookback Period of 20 uses 21 closing prices, including both endpoints. Starting Bar Offset moves the regression's source window into the past; it does not move the plotted line backward on the chart.
2. Understanding the Channel
Both band systems are centered on the regression endpoint and scaled by Band Multiplier.
Deviation Bands
The upper and lower deviation bands use the standard deviation of the latest Lookback Period + 1 closing prices. They provide a reference for recent price dispersion around the regression centerline.
Regression Bands
The layer labeled Regression Bands uses a custom root-mean-square calculation that compares historical closes with regression endpoints from successively shifted historical windows. This is not the conventional residual standard deviation of one fitted polynomial. These boundaries are transparent and are primarily represented through the shaded regions between the two band systems.
Neither band system is a statistical confidence interval. The deviation bands are not necessarily the outermost boundaries, and a band touch does not establish that price must reverse. Starting Bar Offset affects the regression calculations, while the price-deviation width continues to use the latest closes.
3. Centerline Color and Candle Momentum
The centerline color uses its one-bar change normalized by 0.1 × ATR(14), with Trend Sensitivity defining the neutral threshold. In this version, the mapping is inverse: a sufficiently falling centerline uses the selected bullish color, a sufficiently rising centerline uses the bearish color, and values within the threshold use the neutral color.
Candle coloring uses a separate calculation: the change in the centerline over Momentum Period, divided by ATR(14), scaled by Gradient Sensitivity, and limited to a range of −1 to +1.
- Positive momentum moves candle colors toward the bullish color.
- Negative momentum moves candle colors toward the bearish color.
- Values near zero use the midpoint blend between those two colors. The Neutral Color setting applies to the centerline, not this candle gradient.
Higher Gradient Sensitivity values require a larger ATR-normalized move to reach full color intensity. Candle colors describe regression momentum and can differ from each candle's actual open-to-close direction.
4. Two-Candle Reversal Markers
The markers use the deviation bands and actual candle prices—not the momentum colors or centerline color.
- Bearish ▼: The previous candle's high exceeds its upper deviation band and that candle closes above its open. The current candle then closes below its open.
- Bullish ▲: The previous candle's low falls below its lower deviation band and that candle closes below its open. The current candle then closes above its open.
The first candle only needs to trade beyond its band; it does not need to close beyond it. The second candle does not have to close back inside the channel, engulf the previous candle, or break its high or low. Doji candles do not satisfy the required directional conditions.
In this example, a bearish marker is followed by a brief decline and then a rise. The annotation demonstrates the pattern's conditions rather than a guaranteed change in direction. Read each candle's open and close when checking the rule, because momentum coloring can obscure its usual bullish or bearish appearance.
Settings Guide
- Lookback Period — default 20: Sets the regression window and price-deviation calculation to the selected value plus one observations. Longer windows use more history and require more computation.
- Polynomial Degree — default 2: Selects Degree 1, 2, or 3. Keep Lookback Period at least as large as the degree so the fit has enough observations.
- Starting Bar Offset — default 0: Selects how many bars ago the regression source window ends.
- Band Multiplier — default 2.0: Scales both channel widths. Higher values widen the bands; zero collapses them to the centerline.
- Trend Sensitivity — default 0.01: Sets the threshold used for centerline coloring. With nonnegative values, a higher threshold creates a wider neutral range.
- Momentum Period — default 14: Sets the interval over which centerline change is measured for candle coloring.
- Gradient Sensitivity — default 5.0: Controls the momentum magnitude needed for full color saturation.
- Display Settings: Toggle the centerline, regression-band layer, deviation bands, momentum candles, and reversal markers. Show Band Fills controls the primary translucent fills; the additional gradient fills remain active while both band layers are enabled.
- Color Settings: Customize bullish, bearish, and neutral colors.
Calculation Behavior and Limitations
The indicator uses the current chart's price data without higher-timeframe requests or future-bar references. It plots a rolling endpoint series rather than redrawing one newly fitted curve across earlier candles.
Values on the open bar can change as price updates. A reversal marker may appear or disappear before that bar closes, so evaluate completed patterns after the close. Changes to settings or the underlying price data can also alter historical results.
Higher polynomial degrees can react strongly to local price changes. The custom regression-band calculation requires additional historical data and can become computationally expensive at long lookbacks. Allow sufficient history for the selected window and offset.
This is an analytical indicator, not a trading strategy. It includes no built-in alert conditions, automated orders, stop-loss or take-profit rules, or performance backtest.
Free and open source for inspection and learning. The model describes historical price behavior; it does not guarantee future direction or trading results.

Get access: smrtalgo.com
Join our Discord: discord.com/invite/f7gVrMPkaC
All content provided by SMRT Algo is for informational & educational purposes only. Past performance does not guarantee future results.
Join our Discord: discord.com/invite/f7gVrMPkaC
All content provided by SMRT Algo is for informational & educational purposes only. Past performance does not guarantee future results.
Thông báo miễn trừ trách nhiệm
Thông tin và các ấn phẩm này không nhằm mục đích, và không cấu thành, lời khuyên hoặc khuyến nghị về tài chính, đầu tư, giao dịch hay các loại khác do TradingView cung cấp hoặc xác nhận. Đọc thêm tại Điều khoản Sử dụng.
Get access: smrtalgo.com
Join our Discord: discord.com/invite/f7gVrMPkaC
All content provided by SMRT Algo is for informational & educational purposes only. Past performance does not guarantee future results.
Join our Discord: discord.com/invite/f7gVrMPkaC
All content provided by SMRT Algo is for informational & educational purposes only. Past performance does not guarantee future results.
Thông báo miễn trừ trách nhiệm
Thông tin và các ấn phẩm này không nhằm mục đích, và không cấu thành, lời khuyên hoặc khuyến nghị về tài chính, đầu tư, giao dịch hay các loại khác do TradingView cung cấp hoặc xác nhận. Đọc thêm tại Điều khoản Sử dụng.