OPEN-SOURCE SCRIPT
Adaptive Market Suite [Jayadev Rana]
Overview
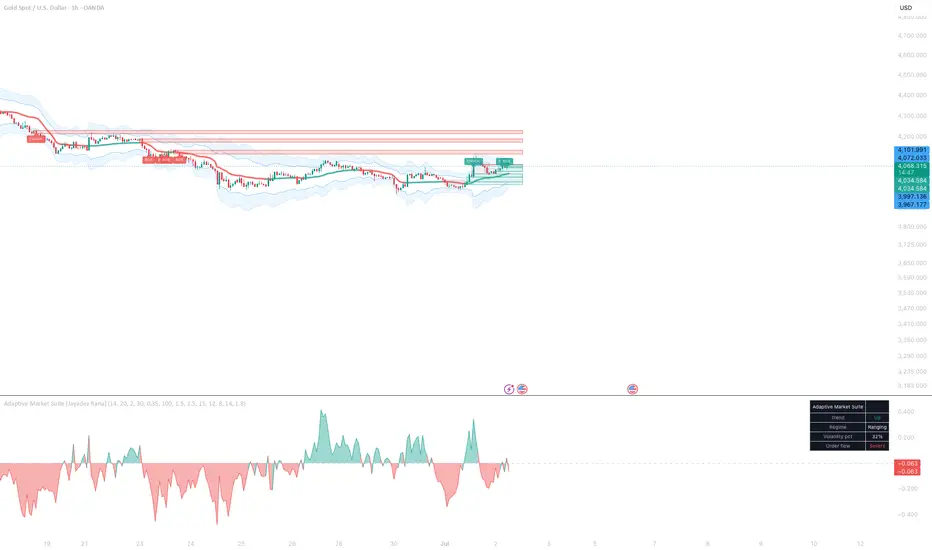
Adaptive Market Suite is a four-module analysis toolkit that draws on the price chart. Each module is independent: turn any of them on or off, and each has its own settings group. It shows context, not buy or sell arrows. The four modules are an adaptive trend, volatility bands, market structure with order blocks and fair-value gaps, and an order-flow oscillator. You read the confluence and make your own decisions.
Module 1 - Adaptive Trend and Regime
A moving average whose smoothing adapts to Kaufman's efficiency ratio: the net distance price travelled divided by the total path it took to get there. In clean trends the ratio is high and the average speeds up to hug price; in chop it is low and the average slows and flattens. The line is coloured by its slope, and the info panel reports whether the market is trending or ranging from the same ratio.
Module 2 - Expected-Move Bands
Volatility bands around the adaptive basis. Instead of a fixed multiple of range, the band width scales with where the current Average True Range sits in its own recent history (its percentile), so the bands contract in quiet conditions and expand when volatility rises. A nearer pair and a wider pair mark two envelopes.
Module 3 - Liquidity and Structure
Market structure from confirmed swing pivots, labelled as Break of Structure and Change of Character. Because the pivots are symmetric (confirmed on both sides), they are fixed before they are drawn and do not repaint afterward. On a structure break the tool marks the order block behind the move (the last opposite-direction candle before the push) and it tracks fair-value gaps, which are three-bar imbalances. Each zone follows a mitigation lifecycle: it is extended while it is live and greyed once price trades through it, and only the most recent zones per type are kept so the chart stays readable.
Module 4 - Order-Flow Oscillator
A normalised buy and sell pressure read in the indicator pane. For each bar it combines where price closed within the bar's range with how large that bar's volume was relative to its recent average. Sustained closes near the highs on strong volume push the oscillator positive; the mirror pushes it negative. An absorption marker highlights bars with heavy volume but a small range, where effort is not producing movement.
Info panel
An optional compact table summarises the current trend direction, the regime read, the volatility percentile, and the current order-flow side. It is context only.
Inputs
Inputs are grouped per module: General (ATR length); Module 1 (efficiency length, fast and slow smoothing, regime threshold, colours); Module 2 (volatility lookback, base and extra width, colour); Module 3 (swing length, order-block lookback, max zones per type, toggles for structure, order blocks and fair-value gaps, colours); Module 4 (pressure smoothing, absorption threshold, colours); plus an info-panel toggle. Every module has a single enable switch.
Alerts
Bullish and bearish structure break, and the order-flow oscillator crossing above or below zero.
How to use it
Treat it as a confluence map rather than a signal. For example, price reaching an order block near the lower band, with the order-flow oscillator turning up while the adaptive trend is still rising, is a stronger context than any one of those alone. Turn off the modules you do not need: if you only trade structure, disable the other three groups for a clean map. It is intended for liquid instruments and works across timeframes; the demonstration chart is Gold on the 1-hour timeframe.
Limitations
The structure module confirms swings with bars on both sides, so its labels and order blocks appear a fixed number of bars after the pivot forms. That delay is the trade-off that keeps them from repainting. The bands, the oscillator and the info panel read the current bar and update as it forms, like any live calculation. This is an analysis tool, not a strategy: it places no orders, makes no performance claim, and there is no win rate because it does not promise trades.
Disclaimer
For education and research only. This is not financial advice, and past chart behaviour does not predict future results. Test any approach yourself and manage your own risk.
Adaptive Market Suite is a four-module analysis toolkit that draws on the price chart. Each module is independent: turn any of them on or off, and each has its own settings group. It shows context, not buy or sell arrows. The four modules are an adaptive trend, volatility bands, market structure with order blocks and fair-value gaps, and an order-flow oscillator. You read the confluence and make your own decisions.
Module 1 - Adaptive Trend and Regime
A moving average whose smoothing adapts to Kaufman's efficiency ratio: the net distance price travelled divided by the total path it took to get there. In clean trends the ratio is high and the average speeds up to hug price; in chop it is low and the average slows and flattens. The line is coloured by its slope, and the info panel reports whether the market is trending or ranging from the same ratio.
Module 2 - Expected-Move Bands
Volatility bands around the adaptive basis. Instead of a fixed multiple of range, the band width scales with where the current Average True Range sits in its own recent history (its percentile), so the bands contract in quiet conditions and expand when volatility rises. A nearer pair and a wider pair mark two envelopes.
Module 3 - Liquidity and Structure
Market structure from confirmed swing pivots, labelled as Break of Structure and Change of Character. Because the pivots are symmetric (confirmed on both sides), they are fixed before they are drawn and do not repaint afterward. On a structure break the tool marks the order block behind the move (the last opposite-direction candle before the push) and it tracks fair-value gaps, which are three-bar imbalances. Each zone follows a mitigation lifecycle: it is extended while it is live and greyed once price trades through it, and only the most recent zones per type are kept so the chart stays readable.
Module 4 - Order-Flow Oscillator
A normalised buy and sell pressure read in the indicator pane. For each bar it combines where price closed within the bar's range with how large that bar's volume was relative to its recent average. Sustained closes near the highs on strong volume push the oscillator positive; the mirror pushes it negative. An absorption marker highlights bars with heavy volume but a small range, where effort is not producing movement.
Info panel
An optional compact table summarises the current trend direction, the regime read, the volatility percentile, and the current order-flow side. It is context only.
Inputs
Inputs are grouped per module: General (ATR length); Module 1 (efficiency length, fast and slow smoothing, regime threshold, colours); Module 2 (volatility lookback, base and extra width, colour); Module 3 (swing length, order-block lookback, max zones per type, toggles for structure, order blocks and fair-value gaps, colours); Module 4 (pressure smoothing, absorption threshold, colours); plus an info-panel toggle. Every module has a single enable switch.
Alerts
Bullish and bearish structure break, and the order-flow oscillator crossing above or below zero.
How to use it
Treat it as a confluence map rather than a signal. For example, price reaching an order block near the lower band, with the order-flow oscillator turning up while the adaptive trend is still rising, is a stronger context than any one of those alone. Turn off the modules you do not need: if you only trade structure, disable the other three groups for a clean map. It is intended for liquid instruments and works across timeframes; the demonstration chart is Gold on the 1-hour timeframe.
Limitations
The structure module confirms swings with bars on both sides, so its labels and order blocks appear a fixed number of bars after the pivot forms. That delay is the trade-off that keeps them from repainting. The bands, the oscillator and the info panel read the current bar and update as it forms, like any live calculation. This is an analysis tool, not a strategy: it places no orders, makes no performance claim, and there is no win rate because it does not promise trades.
Disclaimer
For education and research only. This is not financial advice, and past chart behaviour does not predict future results. Test any approach yourself and manage your own risk.
Mã nguồn mở
Theo đúng tinh thần TradingView, tác giả của tập lệnh này đã công bố nó dưới dạng mã nguồn mở, để các nhà giao dịch có thể xem xét và xác minh chức năng. Chúc mừng tác giả! Mặc dù bạn có thể sử dụng miễn phí, hãy nhớ rằng việc công bố lại mã phải tuân theo Nội quy.

Thông báo miễn trừ trách nhiệm
Thông tin và các ấn phẩm này không nhằm mục đích, và không cấu thành, lời khuyên hoặc khuyến nghị về tài chính, đầu tư, giao dịch hay các loại khác do TradingView cung cấp hoặc xác nhận. Đọc thêm tại Điều khoản Sử dụng.
Mã nguồn mở
Theo đúng tinh thần TradingView, tác giả của tập lệnh này đã công bố nó dưới dạng mã nguồn mở, để các nhà giao dịch có thể xem xét và xác minh chức năng. Chúc mừng tác giả! Mặc dù bạn có thể sử dụng miễn phí, hãy nhớ rằng việc công bố lại mã phải tuân theo Nội quy.
Thông báo miễn trừ trách nhiệm
Thông tin và các ấn phẩm này không nhằm mục đích, và không cấu thành, lời khuyên hoặc khuyến nghị về tài chính, đầu tư, giao dịch hay các loại khác do TradingView cung cấp hoặc xác nhận. Đọc thêm tại Điều khoản Sử dụng.