Breakout Sniper Pro Live Strong Weak Signals Monthly Stats
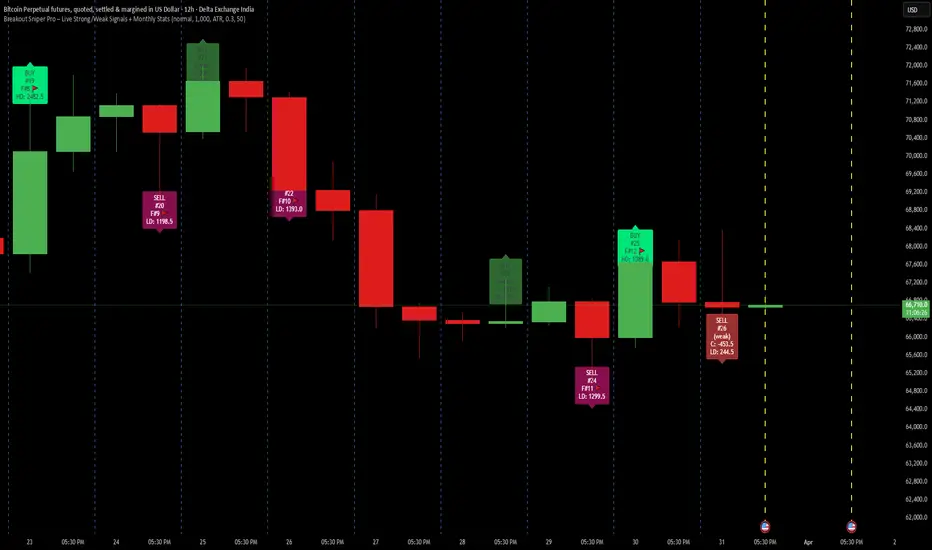
📌 Indicator Name
⚡ Breakout Sniper Pro Live Strong Weak Signals Monthly Stats
🧠 Concept / Logic Overview
This indicator detects real-time breakout opportunities based on the previous candle’s high and low levels.
Unlike traditional indicators, it does not wait for candle close.
Signals are generated instantly when price breaks key levels, allowing early entries.
The script also classifies signals into:
Strong Breakouts 🚩
Weak Breakouts
And maintains monthly performance tracking.
⚙️ Core Logic Explained
🔹 1. Breakout Detection (LIVE)
BUY Signal:
Triggered when current candle high breaks previous candle high
SELL Signal:
Triggered when current candle low breaks previous candle low
✔ Uses:
high > previous high
low < previous low
👉 This makes it real-time (intra-candle) instead of waiting for close.
🔹 2. One Signal Per Candle
To avoid multiple signals in the same candle:
Signal is triggered only on first breakout
Prevents label spam
🔹 3. Strong vs Weak Classification
Breakouts are classified using a threshold value:
Strong Breakout 🚩
When price move exceeds defined threshold
Weak Breakout
When move is smaller than threshold
✔ Measurements used:
High Difference (HD) → For BUY strength
Low Difference (LD) → For SELL strength
🔹 4. Additional Close-Based Insight
For weak signals:
Displays close-based difference (C value)
Helps understand if breakout held or rejected
🔹 5. Monthly Tracking System 📅
The script automatically tracks:
Total signals generated
Total strong breakout flags 🚩
✔ Resets every new month
⚙️ Inputs Explained
🔧 Label Size
Controls size of BUY/SELL labels
Options: Tiny → Huge
🔧 Flag Threshold
Defines strength of breakout
Higher value = fewer strong signals
🔧 Gap Type
Controls distance of labels from candles:
ATR Mode
Dynamic spacing based on volatility
Points Mode
Fixed manual spacing
🔧 ATR Multiplier
Used when ATR mode is selected
Adjusts spacing dynamically
🔧 Manual Gap (Points)
Used in Points mode
Fixed distance between label and candle
📊 Outputs / What You See on Chart
🟢 BUY Labels
Appears above candle
Shows:
Signal number (#)
Strong flag 🚩 (if applicable)
Close difference (for weak)
High Difference (HD)
🔴 SELL Labels
Appears below candle
Shows:
Signal number (#)
Strong flag 🚩 (if applicable)
Close difference (for weak)
Low Difference (LD)
🚩 Strong Signals
Highlighted with:
Bright colors
Flag symbol
Indicates high momentum breakout
📈 Weak Signals
Lighter color
Includes extra data for confirmation
⚠️ Important Behavior
This is a live breakout indicator
Signals can appear before candle close
Price may reverse within same candle
👉 This is not repainting, but expected real-time behavior
🎯 Best Use Cases
Scalping strategies
Intraday trading
Breakout trading setups
Momentum-based entries
💡 Tips for Better Accuracy
Use alongside:
Trend direction
Support & resistance zones
Volume confirmation
🚨 Disclaimer
This indicator is for educational and informational purposes only.
Always use proper risk management before trading.
⚡ Breakout Sniper Pro Live Strong Weak Signals Monthly Stats
🧠 Concept / Logic Overview
This indicator detects real-time breakout opportunities based on the previous candle’s high and low levels.
Unlike traditional indicators, it does not wait for candle close.
Signals are generated instantly when price breaks key levels, allowing early entries.
The script also classifies signals into:
Strong Breakouts 🚩
Weak Breakouts
And maintains monthly performance tracking.
⚙️ Core Logic Explained
🔹 1. Breakout Detection (LIVE)
BUY Signal:
Triggered when current candle high breaks previous candle high
SELL Signal:
Triggered when current candle low breaks previous candle low
✔ Uses:
high > previous high
low < previous low
👉 This makes it real-time (intra-candle) instead of waiting for close.
🔹 2. One Signal Per Candle
To avoid multiple signals in the same candle:
Signal is triggered only on first breakout
Prevents label spam
🔹 3. Strong vs Weak Classification
Breakouts are classified using a threshold value:
Strong Breakout 🚩
When price move exceeds defined threshold
Weak Breakout
When move is smaller than threshold
✔ Measurements used:
High Difference (HD) → For BUY strength
Low Difference (LD) → For SELL strength
🔹 4. Additional Close-Based Insight
For weak signals:
Displays close-based difference (C value)
Helps understand if breakout held or rejected
🔹 5. Monthly Tracking System 📅
The script automatically tracks:
Total signals generated
Total strong breakout flags 🚩
✔ Resets every new month
⚙️ Inputs Explained
🔧 Label Size
Controls size of BUY/SELL labels
Options: Tiny → Huge
🔧 Flag Threshold
Defines strength of breakout
Higher value = fewer strong signals
🔧 Gap Type
Controls distance of labels from candles:
ATR Mode
Dynamic spacing based on volatility
Points Mode
Fixed manual spacing
🔧 ATR Multiplier
Used when ATR mode is selected
Adjusts spacing dynamically
🔧 Manual Gap (Points)
Used in Points mode
Fixed distance between label and candle
📊 Outputs / What You See on Chart
🟢 BUY Labels
Appears above candle
Shows:
Signal number (#)
Strong flag 🚩 (if applicable)
Close difference (for weak)
High Difference (HD)
🔴 SELL Labels
Appears below candle
Shows:
Signal number (#)
Strong flag 🚩 (if applicable)
Close difference (for weak)
Low Difference (LD)
🚩 Strong Signals
Highlighted with:
Bright colors
Flag symbol
Indicates high momentum breakout
📈 Weak Signals
Lighter color
Includes extra data for confirmation
⚠️ Important Behavior
This is a live breakout indicator
Signals can appear before candle close
Price may reverse within same candle
👉 This is not repainting, but expected real-time behavior
🎯 Best Use Cases
Scalping strategies
Intraday trading
Breakout trading setups
Momentum-based entries
💡 Tips for Better Accuracy
Use alongside:
Trend direction
Support & resistance zones
Volume confirmation
🚨 Disclaimer
This indicator is for educational and informational purposes only.
Always use proper risk management before trading.

Thông báo miễn trừ trách nhiệm
Thông tin và các ấn phẩm này không nhằm mục đích, và không cấu thành, lời khuyên hoặc khuyến nghị về tài chính, đầu tư, giao dịch hay các loại khác do TradingView cung cấp hoặc xác nhận. Đọc thêm tại Điều khoản Sử dụng.
Thông báo miễn trừ trách nhiệm
Thông tin và các ấn phẩm này không nhằm mục đích, và không cấu thành, lời khuyên hoặc khuyến nghị về tài chính, đầu tư, giao dịch hay các loại khác do TradingView cung cấp hoặc xác nhận. Đọc thêm tại Điều khoản Sử dụng.