Directional Kernel Filter [BackQuant]
More exclusive indicators from BackQuant
Subscribe to Trading & Portfolio Toolkit for $69.99/month to get exclusive indicators by this author. You pay right on TradingView and can use them on your charts straight away.
Explore Trading & Portfolio ToolkitDirectional Kernel Filter [BackQuant]
Overview
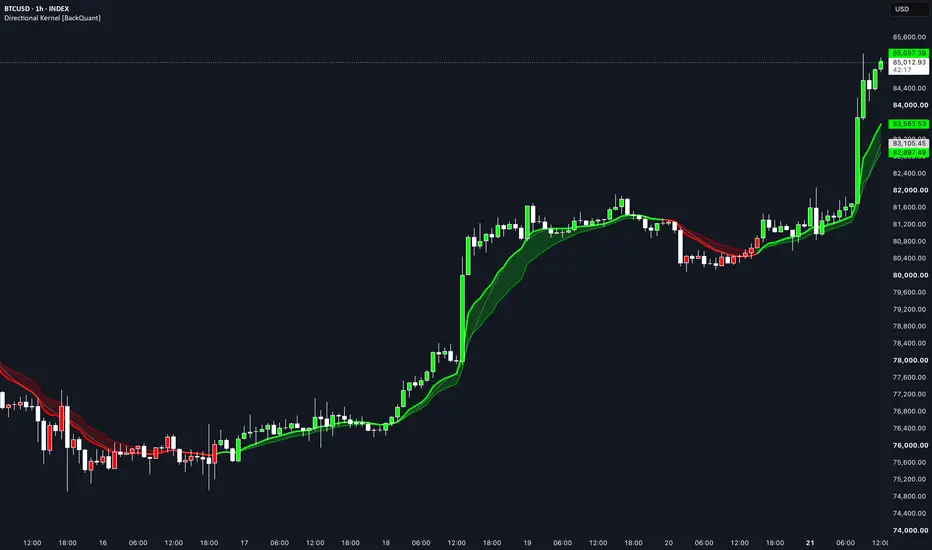
Directional Kernel Filter is a trend overlay built from Gaussian-weighted price smoothing with an additional directional weighting term.
The indicator calculates fast and slow versions of the filter. Trend is determined by their relative position:
The purpose of the directional weighting is simply to give slightly more influence to historical observations whose local price movement agrees with the previously estimated filter direction, and less influence to observations moving against it.
It is a custom smoothing method, not a machine-learning model or price-prediction system.
Base Gaussian Kernel
Each filter begins with a Gaussian-weighted average of the selected Source.
For every observation in the lookback:
where distance depends on how far the observation is from the current bar relative to the selected kernel bandwidth.
More recent observations receive greater weight.
Older observations receive progressively less.
The result is the Base Gaussian Kernel.
Kernel Width
Kernel Width controls the effective bandwidth of the Gaussian weighting.
The bandwidth is:
Lower values concentrate more weight near the current bar.
Higher values distribute weight more broadly across the lookback.
This changes the responsiveness of both the base and directionally weighted filters.
Directional Reference
The filter then measures the previous direction of the Base Gaussian Kernel:
This movement is divided by ATR so the directional reference is expressed relative to recent market range.
The normalized value is capped between -1 and +1.
Conceptually:
Local Direction
Each historical observation is also assigned a local price movement:
This is also normalized by ATR and constrained between -1 and +1.
The script then compares the sign and magnitude of the historical local move with the previous filter direction.
Directional Alignment
Alignment is calculated as:
This creates three general cases.
Positive alignment
The historical movement agrees with the previous filter direction.
Its directional weight is increased.
Negative alignment
The historical movement opposes the previous direction.
Its directional weight is reduced.
Near-zero alignment
The observation receives little directional adjustment.
Directional Weight
The directional adjustment is applied exponentially:
The internal exponent is limited to control extreme weighting.
The final observation weight becomes:
The filtered value is the weighted average of Source using these final weights.
Directional Weight setting
The Directional Weight input controls how strongly alignment changes the Gaussian weights.
0
Disables directional weighting.
The output becomes the Base Gaussian Kernel.
Higher values
Increase the difference between observations that agree with the previous direction and those that oppose it.
Higher values therefore create a stronger directional bias in the smoothing process.
This does not predict which direction price will move next. It only changes how the historical observations inside the current filter window are weighted.
ATR Normalization
ATR is used only to normalize the directional movements.
This makes a given price change more comparable across:
ATR does not define the trend state or act as a volatility band.
The Normalization Length controls the ATR period used for this scaling.
Fast and Slow Kernels
The script calculates two independent versions of the same filter:
The Fast Kernel uses the Fast Kernel Length.
The Slow Kernel uses the Slow Length.
The same:
are applied to both.
Trend State
Trend is determined from the relationship between the two filters.
If they are exactly equal, the previous trend state remains unchanged.
This is similar in structure to a conventional fast/slow moving-average trend filter, but the underlying lines use Gaussian and directional weighting instead of a standard MA formula.
Trend Ribbon
The optional ribbon fills the area between the Fast and Slow Directional Kernels.
The colour follows the current trend state.
A wider spread means greater separation between the two filters.
A narrow spread means they are closer together.
The ribbon itself does not introduce additional signal logic.
Base Kernel Comparison
The Base Gaussian Kernel can optionally be displayed.
This provides a direct comparison between:
The difference between the Fast Directional Kernel and its Base Gaussian Kernel is also available in the Data Window.
This makes it possible to see how much the directional weighting is actually changing the result.
Data Window
The indicator exposes several diagnostic values.
Fast Reference Direction
ATR-normalized previous direction of the Fast Base Kernel.
Slow Reference Direction
ATR-normalized previous direction of the Slow Base Kernel.
Directional Adjustment
Difference between the Fast Directional Kernel and the Fast Base Gaussian Kernel.
A value near zero means directional weighting is having little effect at that bar.
Kernel Spread
Difference between the Fast and Slow Directional Kernels.
Positive values correspond to the bullish state.
Negative values correspond to the bearish state.
Input Guide
Fast Kernel Length
Controls the lookback of the faster filter.
Shorter values respond more quickly.
Slow Length
Controls the slower trend filter.
Larger separation between Fast and Slow lengths generally creates a more persistent crossover structure.
Kernel Width
Controls how concentrated the Gaussian weighting is toward recent observations.
Lower values emphasize recent bars more strongly.
Directional Weight
Controls how much directional alignment changes the Gaussian weights.
Set to 0 to disable the directional adjustment.
Normalization Length
ATR period used to normalize filter direction and local price movement.
How to use it
The indicator can be used as:
The optional candle and background colouring simply reflect the same Fast-versus-Slow trend state.
Limitations
Alerts
The script provides:
Summary
Directional Kernel Filter starts with a Gaussian-weighted smoother.
It then measures the previous direction of that base smoother and compares it with the local direction of each observation inside the lookback.
Observations aligned with the previous filter direction receive more weight, while opposing observations receive less.
Fast and Slow versions of the resulting filter are then compared to determine the bullish or bearish trend state.
The indicator is simply a custom directional weighting variation of Gaussian price smoothing, with the Base Kernel available for comparison so the effect of the additional weighting can be inspected directly.
Overview
Directional Kernel Filter is a trend overlay built from Gaussian-weighted price smoothing with an additional directional weighting term.
The indicator calculates fast and slow versions of the filter. Trend is determined by their relative position:
- Fast Kernel above Slow Kernel = bullish.
- Fast Kernel below Slow Kernel = bearish.
The purpose of the directional weighting is simply to give slightly more influence to historical observations whose local price movement agrees with the previously estimated filter direction, and less influence to observations moving against it.
It is a custom smoothing method, not a machine-learning model or price-prediction system.
Base Gaussian Kernel
Each filter begins with a Gaussian-weighted average of the selected Source.
For every observation in the lookback:
- Weight = exp(-0.5 × Distance²)
where distance depends on how far the observation is from the current bar relative to the selected kernel bandwidth.
More recent observations receive greater weight.
Older observations receive progressively less.
The result is the Base Gaussian Kernel.
Kernel Width
Kernel Width controls the effective bandwidth of the Gaussian weighting.
The bandwidth is:
- Filter Length × Kernel Width
Lower values concentrate more weight near the current bar.
Higher values distribute weight more broadly across the lookback.
This changes the responsiveness of both the base and directionally weighted filters.
Directional Reference
The filter then measures the previous direction of the Base Gaussian Kernel:
- Previous Direction = Base[1] - Base[2]
This movement is divided by ATR so the directional reference is expressed relative to recent market range.
The normalized value is capped between -1 and +1.
Conceptually:
- Positive = the base filter was rising.
- Negative = the base filter was falling.
- Near zero = little recent movement.
Local Direction
Each historical observation is also assigned a local price movement:
- Local Move = Source - Source[i+1]
This is also normalized by ATR and constrained between -1 and +1.
The script then compares the sign and magnitude of the historical local move with the previous filter direction.
Directional Alignment
Alignment is calculated as:
- Alignment = Previous Direction × Local Direction
This creates three general cases.
Positive alignment
The historical movement agrees with the previous filter direction.
Its directional weight is increased.
Negative alignment
The historical movement opposes the previous direction.
Its directional weight is reduced.
Near-zero alignment
The observation receives little directional adjustment.
Directional Weight
The directional adjustment is applied exponentially:
- Directional Weight = exp(Directional Strength × Alignment)
The internal exponent is limited to control extreme weighting.
The final observation weight becomes:
- Final Weight = Gaussian Weight × Directional Weight
The filtered value is the weighted average of Source using these final weights.
Directional Weight setting
The Directional Weight input controls how strongly alignment changes the Gaussian weights.
0
Disables directional weighting.
The output becomes the Base Gaussian Kernel.
Higher values
Increase the difference between observations that agree with the previous direction and those that oppose it.
Higher values therefore create a stronger directional bias in the smoothing process.
This does not predict which direction price will move next. It only changes how the historical observations inside the current filter window are weighted.
ATR Normalization
ATR is used only to normalize the directional movements.
This makes a given price change more comparable across:
- Different instruments.
- Different price levels.
- Different volatility conditions.
ATR does not define the trend state or act as a volatility band.
The Normalization Length controls the ATR period used for this scaling.
Fast and Slow Kernels
The script calculates two independent versions of the same filter:
- Fast Directional Kernel.
- Slow Directional Kernel.
The Fast Kernel uses the Fast Kernel Length.
The Slow Kernel uses the Slow Length.
The same:
- Kernel Width.
- Directional Weight.
- ATR normalization.
are applied to both.
Trend State
Trend is determined from the relationship between the two filters.
- Fast Kernel > Slow Kernel = bullish.
- Fast Kernel < Slow Kernel = bearish.
If they are exactly equal, the previous trend state remains unchanged.
This is similar in structure to a conventional fast/slow moving-average trend filter, but the underlying lines use Gaussian and directional weighting instead of a standard MA formula.
Trend Ribbon
The optional ribbon fills the area between the Fast and Slow Directional Kernels.
The colour follows the current trend state.
A wider spread means greater separation between the two filters.
A narrow spread means they are closer together.
The ribbon itself does not introduce additional signal logic.
Base Kernel Comparison
The Base Gaussian Kernel can optionally be displayed.
This provides a direct comparison between:
- The normal Gaussian smoother.
- The directionally reweighted version.
The difference between the Fast Directional Kernel and its Base Gaussian Kernel is also available in the Data Window.
This makes it possible to see how much the directional weighting is actually changing the result.
Data Window
The indicator exposes several diagnostic values.
Fast Reference Direction
ATR-normalized previous direction of the Fast Base Kernel.
Slow Reference Direction
ATR-normalized previous direction of the Slow Base Kernel.
Directional Adjustment
Difference between the Fast Directional Kernel and the Fast Base Gaussian Kernel.
A value near zero means directional weighting is having little effect at that bar.
Kernel Spread
Difference between the Fast and Slow Directional Kernels.
Positive values correspond to the bullish state.
Negative values correspond to the bearish state.
Input Guide
Fast Kernel Length
Controls the lookback of the faster filter.
Shorter values respond more quickly.
Slow Length
Controls the slower trend filter.
Larger separation between Fast and Slow lengths generally creates a more persistent crossover structure.
Kernel Width
Controls how concentrated the Gaussian weighting is toward recent observations.
Lower values emphasize recent bars more strongly.
Directional Weight
Controls how much directional alignment changes the Gaussian weights.
Set to 0 to disable the directional adjustment.
Normalization Length
ATR period used to normalize filter direction and local price movement.
How to use it
The indicator can be used as:
- A fast/slow trend filter.
- A directional overlay for broader chart context.
- A way to compare a normal Gaussian smoother with a directionally reweighted version.
The optional candle and background colouring simply reflect the same Fast-versus-Slow trend state.
Limitations
- The indicator is reactive and uses only current and historical price data.
- Directional weighting is based on the previously estimated filter direction; it does not forecast future direction.
- High Directional Weight settings can make the filter more sensitive to the recent directional structure.
- Fast/slow crossovers can still switch frequently during sideways markets.
- ATR is used only as a normalization scale and does not make the filter volatility predictive.
Alerts
The script provides:
- Directional Kernel Bullish: trend changes from bearish to bullish.
- Directional Kernel Bearish: trend changes from bullish to bearish.
Summary
Directional Kernel Filter starts with a Gaussian-weighted smoother.
It then measures the previous direction of that base smoother and compares it with the local direction of each observation inside the lookback.
Observations aligned with the previous filter direction receive more weight, while opposing observations receive less.
Fast and Slow versions of the resulting filter are then compared to determine the bullish or bearish trend state.
The indicator is simply a custom directional weighting variation of Gaussian price smoothing, with the Base Kernel available for comparison so the effect of the additional weighting can be inspected directly.

Join the Paid Space or get access to my invite only scripts at
backquant.com/
Or join the free discord discord.gg/RmVrJV67yE
backquant.com/
Or join the free discord discord.gg/RmVrJV67yE
Thông báo miễn trừ trách nhiệm
Thông tin và các ấn phẩm này không nhằm mục đích, và không cấu thành, lời khuyên hoặc khuyến nghị về tài chính, đầu tư, giao dịch hay các loại khác do TradingView cung cấp hoặc xác nhận. Đọc thêm tại Điều khoản Sử dụng.
Join the Paid Space or get access to my invite only scripts at
backquant.com/
Or join the free discord discord.gg/RmVrJV67yE
backquant.com/
Or join the free discord discord.gg/RmVrJV67yE
Thông báo miễn trừ trách nhiệm
Thông tin và các ấn phẩm này không nhằm mục đích, và không cấu thành, lời khuyên hoặc khuyến nghị về tài chính, đầu tư, giao dịch hay các loại khác do TradingView cung cấp hoặc xác nhận. Đọc thêm tại Điều khoản Sử dụng.