Cập nhật
Open Legacy
OPEN LEGACY
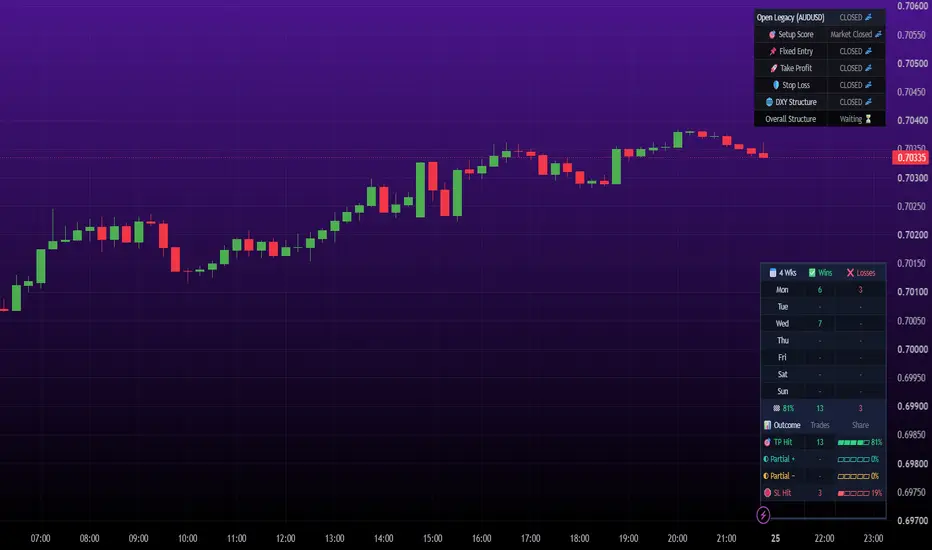
Open Legacy is a signal indicator for manual traders. It marks BUY and SELL entries using one of two classic methods, filtered by one shared trend check. When a signal fires, a heads-up display (HUD) locks the entry, take profit and stop loss, so you have exact numbers to put into your broker. It uses the same engine as Open Legacy Bot, so the same settings give the same signals.
HOW IT FINDS ENTRIES (Entry Method)
• FVG Pullback: a fair value gap is the space left when a candle's low is above the high from two candles earlier (or the reverse for a bearish gap). Gaps smaller than a share of ATR(14) are ignored. A BUY prints when price pulls back into a bullish gap and a candle closes bullish back above the gap's bottom, while the gap is still recent (the reverse for SELL).
• EMA Trend: a BUY prints on the first candle where the fast EMA is above the slow EMA, price closes above the fast EMA and RSI(14) is above 50. It prints once per trend leg, not on every candle (the reverse for SELL).
HOW THE FILTER WORKS (Sensitivity)
One setting controls both methods:
• Aggressive: every valid setup, with faster lengths (EMA 8/21, short gap lifetime).
• Balanced: the setup must also agree with the 50 EMA (EMA 13/34).
• Conservative: also needs price on the same side of the 50 EMA on a timeframe 4x the chart, and ADX(14) of 20 or more (EMA 21/55, longer gap lifetime, larger minimum gap).
Signals only print on a closed candle, so a label never appears and then disappears. The higher-timeframe check reads the previous completed higher-timeframe candle, so it doesn't repaint.
WHY THE PIECES WORK TOGETHER
The entries find the moment to get in. The shared filter decides whether the market is trending enough to act on it. One dial moves both from more signals to fewer, higher-quality ones. The HUD then turns each signal into fixed numbers you can trade by hand.
THE HUD
• Fixed Entry, Take Profit and Stop Loss: locked when the signal fires, using your pip distances. They don't move afterwards. Dashed lines show TP and SL on the chart.
• Setup Score: a 1-99% progress gauge for the open trade. Most of it measures how far price has moved from the stop loss toward the target, with small bonuses or deductions when the chart trend and the benchmark agree or disagree. It is a guide to how the trade is going, not a probability of winning.
• Benchmark Structure: checks a related market that usually moves with or against the chart symbol. It picks the benchmark automatically: DXY for USD pairs and gold, VIX for US and major stock indices, currency indexes for JPY, GBP, EUR, CAD and CHF pairs, and gold for DXY itself. It shows Confirmed when the benchmark supports the trade and Invalid when it has worked against it for a while.
• Overall Structure: Strong when the chart trend and the benchmark agree, Weak when they conflict, and Decent otherwise.
• Market status: shows Closed during the usual weekend and daily breaks, or when the price feed has gone quiet.
ALERTS
Create one alert with the condition "Any alert() function call". You'll get a message for each new BUY or SELL, and when the take profit or stop loss is hit.
SETTINGS
• Entry Method and Sensitivity: see above.
• Stop Loss and Take Profit (pips): your fixed distances. Keep TP larger than SL.
• Points Per Pip: 10 suits gold, indices, BTC and 5-decimal FX.
• Timezone: your own region, so the market-closed status is correct.
• Bar Replay Mode: turn this on while using TradingView's Bar Replay so the HUD keeps updating.
• Colours and HUD position are cosmetic only.
EXAMPLE SETTINGS (starting points, not recommendations)
These were tested on about three months of 1-minute broker data (Jul-Oct 2026) with real spreads. The samples are small (roughly 30-55 trades each), so treat them as starting points to test yourself, not as expected results. The trading hours shown are Irish time (Europe/Dublin), so convert them to your own timezone. For example, 07:00-12:00 Dublin is 11:30-16:30 in India while Ireland is on summer time (12:30-17:30 in winter).
• XAUUSD, 15m: FVG Pullback, Balanced. Traded Mon-Fri 07:00-12:00 (Europe/Dublin). SL 165 / TP 495 pips.
• NAS100, 15m: FVG Pullback, Aggressive. Traded Mon-Fri 18:00-20:30 (Europe/Dublin). SL 550 / TP 1100 pips.
• SP500, 15m: EMA Trend, Conservative. Traded Mon-Fri 14:00-18:00 (Europe/Dublin). SL 58 / TP 116 pips.
This indicator has no session filter, so only take signals during those hours. Pip values depend on your broker's symbol specification, so check the TP and SL lines before trading.
LIMITATIONS
• This indicator doesn't place trades. You enter and manage them yourself, and your fills will differ from the candle close.
• No method works in every market. Results change a lot by symbol, timeframe and settings.
• The benchmark checks need the benchmark symbol's data. When a benchmark market is closed (for example DXY at weekends while crypto trades), that check is skipped.
• Points Per Pip must match your symbol, or the TP and SL levels will be wrong.
This script is for education. It is not financial advice. Past results don't guarantee future results. Test on a demo account first.
Open Legacy is a signal indicator for manual traders. It marks BUY and SELL entries using one of two classic methods, filtered by one shared trend check. When a signal fires, a heads-up display (HUD) locks the entry, take profit and stop loss, so you have exact numbers to put into your broker. It uses the same engine as Open Legacy Bot, so the same settings give the same signals.
HOW IT FINDS ENTRIES (Entry Method)
• FVG Pullback: a fair value gap is the space left when a candle's low is above the high from two candles earlier (or the reverse for a bearish gap). Gaps smaller than a share of ATR(14) are ignored. A BUY prints when price pulls back into a bullish gap and a candle closes bullish back above the gap's bottom, while the gap is still recent (the reverse for SELL).
• EMA Trend: a BUY prints on the first candle where the fast EMA is above the slow EMA, price closes above the fast EMA and RSI(14) is above 50. It prints once per trend leg, not on every candle (the reverse for SELL).
HOW THE FILTER WORKS (Sensitivity)
One setting controls both methods:
• Aggressive: every valid setup, with faster lengths (EMA 8/21, short gap lifetime).
• Balanced: the setup must also agree with the 50 EMA (EMA 13/34).
• Conservative: also needs price on the same side of the 50 EMA on a timeframe 4x the chart, and ADX(14) of 20 or more (EMA 21/55, longer gap lifetime, larger minimum gap).
Signals only print on a closed candle, so a label never appears and then disappears. The higher-timeframe check reads the previous completed higher-timeframe candle, so it doesn't repaint.
WHY THE PIECES WORK TOGETHER
The entries find the moment to get in. The shared filter decides whether the market is trending enough to act on it. One dial moves both from more signals to fewer, higher-quality ones. The HUD then turns each signal into fixed numbers you can trade by hand.
THE HUD
• Fixed Entry, Take Profit and Stop Loss: locked when the signal fires, using your pip distances. They don't move afterwards. Dashed lines show TP and SL on the chart.
• Setup Score: a 1-99% progress gauge for the open trade. Most of it measures how far price has moved from the stop loss toward the target, with small bonuses or deductions when the chart trend and the benchmark agree or disagree. It is a guide to how the trade is going, not a probability of winning.
• Benchmark Structure: checks a related market that usually moves with or against the chart symbol. It picks the benchmark automatically: DXY for USD pairs and gold, VIX for US and major stock indices, currency indexes for JPY, GBP, EUR, CAD and CHF pairs, and gold for DXY itself. It shows Confirmed when the benchmark supports the trade and Invalid when it has worked against it for a while.
• Overall Structure: Strong when the chart trend and the benchmark agree, Weak when they conflict, and Decent otherwise.
• Market status: shows Closed during the usual weekend and daily breaks, or when the price feed has gone quiet.
ALERTS
Create one alert with the condition "Any alert() function call". You'll get a message for each new BUY or SELL, and when the take profit or stop loss is hit.
SETTINGS
• Entry Method and Sensitivity: see above.
• Stop Loss and Take Profit (pips): your fixed distances. Keep TP larger than SL.
• Points Per Pip: 10 suits gold, indices, BTC and 5-decimal FX.
• Timezone: your own region, so the market-closed status is correct.
• Bar Replay Mode: turn this on while using TradingView's Bar Replay so the HUD keeps updating.
• Colours and HUD position are cosmetic only.
EXAMPLE SETTINGS (starting points, not recommendations)
These were tested on about three months of 1-minute broker data (Jul-Oct 2026) with real spreads. The samples are small (roughly 30-55 trades each), so treat them as starting points to test yourself, not as expected results. The trading hours shown are Irish time (Europe/Dublin), so convert them to your own timezone. For example, 07:00-12:00 Dublin is 11:30-16:30 in India while Ireland is on summer time (12:30-17:30 in winter).
• XAUUSD, 15m: FVG Pullback, Balanced. Traded Mon-Fri 07:00-12:00 (Europe/Dublin). SL 165 / TP 495 pips.
• NAS100, 15m: FVG Pullback, Aggressive. Traded Mon-Fri 18:00-20:30 (Europe/Dublin). SL 550 / TP 1100 pips.
• SP500, 15m: EMA Trend, Conservative. Traded Mon-Fri 14:00-18:00 (Europe/Dublin). SL 58 / TP 116 pips.
This indicator has no session filter, so only take signals during those hours. Pip values depend on your broker's symbol specification, so check the TP and SL lines before trading.
LIMITATIONS
• This indicator doesn't place trades. You enter and manage them yourself, and your fills will differ from the candle close.
• No method works in every market. Results change a lot by symbol, timeframe and settings.
• The benchmark checks need the benchmark symbol's data. When a benchmark market is closed (for example DXY at weekends while crypto trades), that check is skipped.
• Points Per Pip must match your symbol, or the TP and SL levels will be wrong.
This script is for education. It is not financial advice. Past results don't guarantee future results. Test on a demo account first.
Phát hành các Ghi chú
OPEN LEGACYOpen Legacy is a signal indicator for manual traders. It marks BUY and SELL entries using one of two classic methods, filtered by one shared trend check. When a signal fires, a heads-up display (HUD) locks the entry, take profit and stop loss, and then rates the trade live until it ends.
HOW IT FINDS ENTRIES (Entry Method)
- FVG Pullback: a fair value gap is the space left when a candle's low is above the high from two candles earlier (or the reverse for a bearish gap). Gaps smaller than a share of ATR(14) are ignored. A BUY prints when price pulls back into a recent bullish gap and a candle closes bullish back above the gap's bottom (the reverse for SELL).
- EMA Trend: a BUY prints on the first candle where the fast EMA is above the slow EMA, price closes above the fast EMA and RSI(14) is above 50. It prints once per trend leg, not on every candle (the reverse for SELL).
HOW THE FILTER WORKS (Sensitivity)
One setting controls both methods:
- Aggressive: every valid setup, with faster lengths (EMA 8/21, short gap lifetime).
- Balanced: the setup must also agree with the 50 EMA (EMA 13/34).
- Conservative: also needs price on the same side of the 50 EMA on a timeframe 4x the chart, and ADX(14) of 20 or more (EMA 21/55, longer gap lifetime, larger minimum gap).
Signals only print on a closed candle, and the higher-timeframe check reads the previous completed candle, so signals don't repaint.
ONE TRADE AT A TIME
After a signal, further signals in the same direction are hidden until that trade hits TP or SL. An opposite signal still flips it.
FILTERS
- Session 1 and Session 2: each has its own hours and days, for example Mon-Fri 07:00-12:00 and Mon-Thu 14:00-18:00. Signals only print inside a ticked session. Leave both unticked to see signals at any time.
- News 1 and News 2: pick a date and time for each event. Signals pause from a set number of minutes before until the same number after.
- All times use the Timezone you set.
- The HUD shows "Off Hours" or "News Pause" while a filter is holding signals back.
THE HUD
- Fixed Entry, Take Profit and Stop Loss: locked when the signal fires, using your pip distances. Dashed lines show TP and SL on the chart.
- Setup Score: the chance price reaches TP before SL from where price is now, using the standard first-passage probability (SL distance divided by the combined TP and SL distance). A new trade with TP twice the SL starts near 33%, and the score rises as price moves toward TP. In tests on over 12,000 trade snapshots across gold, SP500 and NAS100, this predicted TP hits more accurately than a blended score with trend or benchmark bonuses. It is an estimate, not a guarantee.
- Benchmark Structure: checks a related market that usually moves with or against the chart symbol. The benchmark is picked automatically: DXY for USD pairs and gold, VIX for US and major stock indices, currency indexes for JPY, GBP, EUR, CAD and CHF pairs, and gold for DXY itself. It shows Confirmed when the benchmark supports the trade and Invalid when it has worked against it for a while.
- Overall Structure: Strong when the chart trend and the benchmark agree, Weak when they conflict, and Decent otherwise.
- Market status: shows Closed during the usual weekend and daily breaks, or when the price feed goes quiet.
ALERTS
Create one alert with the condition "Any alert() function call". You'll get a message for each new BUY or SELL, and when TP or SL is hit.
SETTINGS
- Entry Method and Sensitivity: see above.
- Stop Loss and Take Profit (pips): fixed distances. Keep TP larger than SL.
- Points Per Pip: 10 suits gold, indices, BTC and 5-decimal FX.
- Session 1 and 2, and News 1 and 2: see Filters.
- Timezone: your own region, for example Europe/Dublin.
- Bar Replay Mode: turn this on while using TradingView's Bar Replay.
- Colours and HUD position are cosmetic only.
LIMITATIONS
- This indicator doesn't place trades, so your fills will differ from the candle close.
- No method works in every market. Results change a lot by symbol, timeframe and settings, so test your own setup.
- TP and SL are fixed in pips and don't adjust to the timeframe. Set them to suit your chart.
- News events have to be entered by hand.
- When a benchmark market is closed (for example DXY at weekends), that check is skipped.
This script is for education. It is not financial advice. Past results don't guarantee future results. Test on a demo account first.
Phát hành các Ghi chú
Bug fixes, with additional improvements!
Thông báo miễn trừ trách nhiệm
Thông tin và các ấn phẩm này không nhằm mục đích, và không cấu thành, lời khuyên hoặc khuyến nghị về tài chính, đầu tư, giao dịch hay các loại khác do TradingView cung cấp hoặc xác nhận. Đọc thêm tại Điều khoản Sử dụng.
Thông báo miễn trừ trách nhiệm
Thông tin và các ấn phẩm này không nhằm mục đích, và không cấu thành, lời khuyên hoặc khuyến nghị về tài chính, đầu tư, giao dịch hay các loại khác do TradingView cung cấp hoặc xác nhận. Đọc thêm tại Điều khoản Sử dụng.