OPEN-SOURCE SCRIPT
Cập nhật RSI StdDev Trend Breakout
Overview
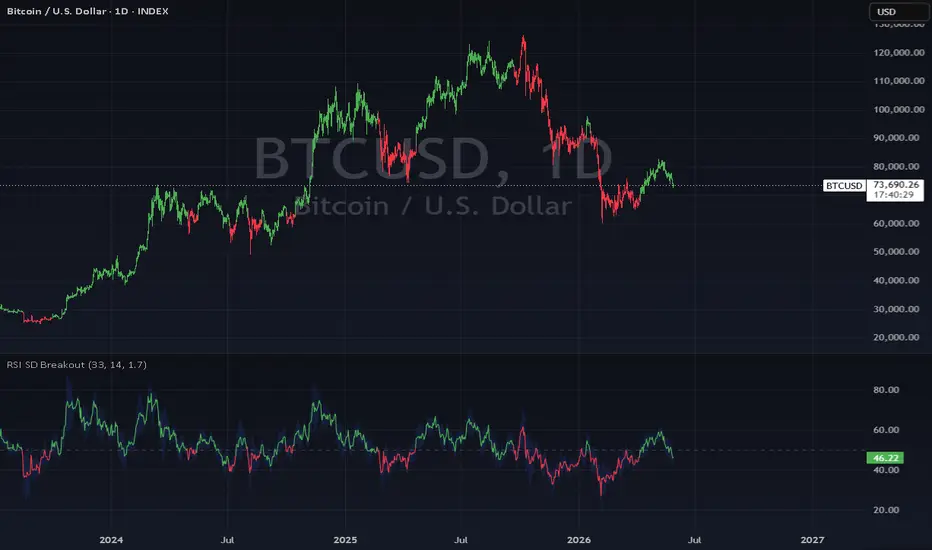
RSI StdDev Trend Breakout is a hybrid momentum and trend indicator built on the Relative Strength Index. It applies dynamic standard deviation bands directly to the RSI to detect meaningful breakout conditions, then uses the RSI midline as a trend filter to confirm bullish or bearish bias.
How It Works
The indicator calculates upper and lower standard deviation bands around the RSI. A bullish signal is triggered when the RSI breaks above the prior upper band while remaining above the midline, indicating upside momentum with trend confirmation. A bearish signal is triggered when the RSI breaks below the prior lower band while remaining below the midline, indicating downside momentum with trend confirmation. Once a bias is established, it persists until the opposing condition is met.
Visual Features
RSI line and candle colors update dynamically based on the current bullish or bearish state
Upper and lower standard deviation bands plotted with a filled channel for quick visual reference
Midline reference at 50 for trend context
Inputs
RSI Length - controls the RSI calculation period
StdDev Period - controls the lookback for standard deviation band calculation
StdDev Multiplier - adjusts the width of the bands
Alerts
Bullish: RSI > 50 and breaks above the upper standard deviation band
Bearish: RSI < 50 and breaks below the lower standard deviation band
RSI StdDev Trend Breakout is a hybrid momentum and trend indicator built on the Relative Strength Index. It applies dynamic standard deviation bands directly to the RSI to detect meaningful breakout conditions, then uses the RSI midline as a trend filter to confirm bullish or bearish bias.
How It Works
The indicator calculates upper and lower standard deviation bands around the RSI. A bullish signal is triggered when the RSI breaks above the prior upper band while remaining above the midline, indicating upside momentum with trend confirmation. A bearish signal is triggered when the RSI breaks below the prior lower band while remaining below the midline, indicating downside momentum with trend confirmation. Once a bias is established, it persists until the opposing condition is met.
Visual Features
RSI line and candle colors update dynamically based on the current bullish or bearish state
Upper and lower standard deviation bands plotted with a filled channel for quick visual reference
Midline reference at 50 for trend context
Inputs
RSI Length - controls the RSI calculation period
StdDev Period - controls the lookback for standard deviation band calculation
StdDev Multiplier - adjusts the width of the bands
Alerts
Bullish: RSI > 50 and breaks above the upper standard deviation band
Bearish: RSI < 50 and breaks below the lower standard deviation band
Phát hành các Ghi chú
.Mã nguồn mở
Theo đúng tinh thần TradingView, tác giả của tập lệnh này đã công bố nó dưới dạng mã nguồn mở, để các nhà giao dịch có thể xem xét và xác minh chức năng. Chúc mừng tác giả! Mặc dù bạn có thể sử dụng miễn phí, hãy nhớ rằng việc công bố lại mã phải tuân theo Nội quy.

Thông báo miễn trừ trách nhiệm
Thông tin và các ấn phẩm này không nhằm mục đích, và không cấu thành, lời khuyên hoặc khuyến nghị về tài chính, đầu tư, giao dịch hay các loại khác do TradingView cung cấp hoặc xác nhận. Đọc thêm tại Điều khoản Sử dụng.
Mã nguồn mở
Theo đúng tinh thần TradingView, tác giả của tập lệnh này đã công bố nó dưới dạng mã nguồn mở, để các nhà giao dịch có thể xem xét và xác minh chức năng. Chúc mừng tác giả! Mặc dù bạn có thể sử dụng miễn phí, hãy nhớ rằng việc công bố lại mã phải tuân theo Nội quy.
Thông báo miễn trừ trách nhiệm
Thông tin và các ấn phẩm này không nhằm mục đích, và không cấu thành, lời khuyên hoặc khuyến nghị về tài chính, đầu tư, giao dịch hay các loại khác do TradingView cung cấp hoặc xác nhận. Đọc thêm tại Điều khoản Sử dụng.