OPEN-SOURCE SCRIPT
Dual-Timeframe ABR Dashboard
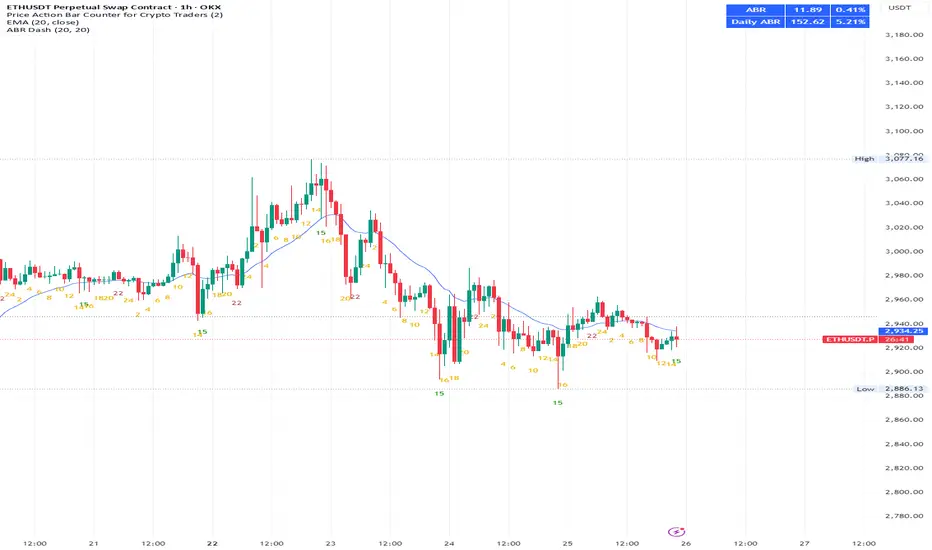
Dual-Timeframe ABR Dashboard 是一款专为日内交易者设计的波动率参考工具,用于同时评估当前周期与日线级别的平均K线波幅(ABR)。
该指标基于 Average Bar Range(高低差的简单平均),帮助交易者快速判断:
单根K线的“正常”波动范围
当前价格相对于 ABR 的百分比位置
当日是否已接近日线级别的常规波动极限
指标不会在图表上绘制干扰性线条,而是通过状态栏与固定表格实时展示最新 ABR 数值,适合用于:
目标利润(TP)与止盈管理
趋势是否具备延续空间的判断
避免在“已走完波幅”的位置追价入场
这是一个为实盘决策服务,而非视觉美观的专业级日内交易辅助指标。
======================================================================
Dual-Timeframe ABR Dashboard is a volatility reference tool designed specifically for day traders, providing a clear view of Average Bar Range (ABR) on both the current timeframe and the daily timeframe.
By measuring the simple average of each bar’s high–low range, this indicator helps traders quickly assess:
What constitutes a “normal” bar movement on the active timeframe
Current price movement expressed as a percentage of ABR
Whether the session has already consumed most of its typical daily range
Instead of plotting lines on the chart, the indicator presents real-time ABR values via the status line and a fixed dashboard table, keeping the chart clean and execution-focused.
This tool is particularly useful for:
Profit target and trade management
Evaluating remaining trend potential during the session
Avoiding late entries after the daily range is largely exhausted
Built for practical intraday decision-making, not visual clutter.
Mã nguồn mở
Theo đúng tinh thần TradingView, tác giả của tập lệnh này đã công bố nó dưới dạng mã nguồn mở, để các nhà giao dịch có thể xem xét và xác minh chức năng. Chúc mừng tác giả! Mặc dù bạn có thể sử dụng miễn phí, hãy nhớ rằng việc công bố lại mã phải tuân theo Nội quy.

Thông báo miễn trừ trách nhiệm
Thông tin và các ấn phẩm này không nhằm mục đích, và không cấu thành, lời khuyên hoặc khuyến nghị về tài chính, đầu tư, giao dịch hay các loại khác do TradingView cung cấp hoặc xác nhận. Đọc thêm tại Điều khoản Sử dụng.
Mã nguồn mở
Theo đúng tinh thần TradingView, tác giả của tập lệnh này đã công bố nó dưới dạng mã nguồn mở, để các nhà giao dịch có thể xem xét và xác minh chức năng. Chúc mừng tác giả! Mặc dù bạn có thể sử dụng miễn phí, hãy nhớ rằng việc công bố lại mã phải tuân theo Nội quy.
Thông báo miễn trừ trách nhiệm
Thông tin và các ấn phẩm này không nhằm mục đích, và không cấu thành, lời khuyên hoặc khuyến nghị về tài chính, đầu tư, giao dịch hay các loại khác do TradingView cung cấp hoặc xác nhận. Đọc thêm tại Điều khoản Sử dụng.