Commodities in Gold
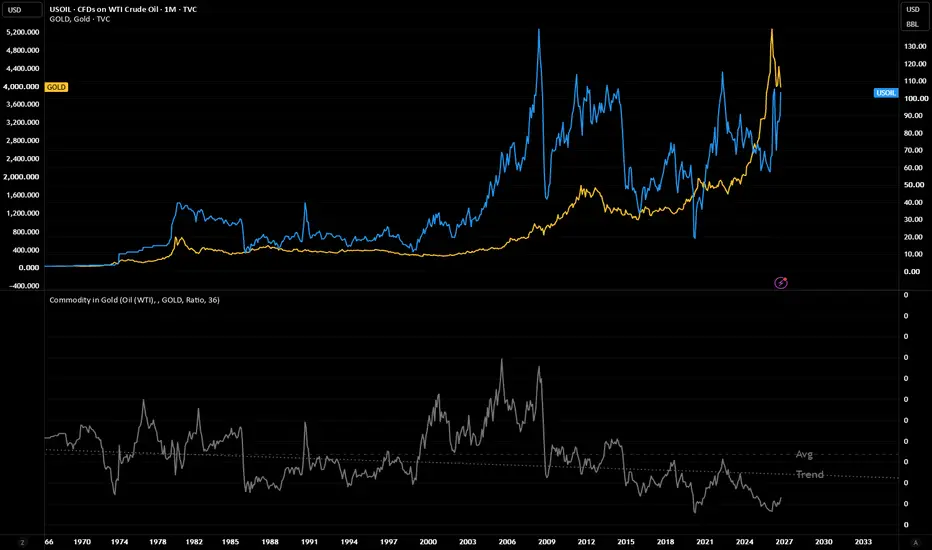
Prices a commodity in ounces of gold instead of dollars, and shows how far that ratio sits from its long-run and recent trend.
Modes
Ratio: commodity price ÷ gold price, with optional full-history average (Avg) and log-linear trend line (Trend).
Gap to trend %: percentage distance of the ratio from a rolling log-linear regression over N bars. Above zero means rich relative to gold on that horizon; below zero means cheap.
Inputs
Commodity: a preset list of energy, metals, grains, softs, livestock and the S&P 500, plus Chart symbol or Custom.
Gold: the denominator, TVC:GOLD by default.
Trend length: the rolling window for Gap mode. 240 bars on monthly ≈ 20 years (long-run value); 36 ≈ 3 years (short-term stretch).
How it’s calculated
Ratio = commodity close ÷ gold close.
Trend = least-squares fit of ln(ratio) against time, converted back with exp(). The Ratio-mode trend uses all loaded history; Gap mode refits on every bar using only the last N bars.
Notes
Best on a monthly chart with the pane on a log scale. The FRED/IMF series (aluminium, nickel, zinc, iron ore, uranium) are monthly.
History is limited to the main chart’s symbol. Use TVC:GOLD as the main chart for the longest data.
Grains and softs are quoted in cents, so ratio values are ×100. The shape and gaps are unaffected.
The S&P 500 preset is price only, excluding dividends. Use SP:SPXTR via Custom for total return.
Descriptive, not a timing signal.
Modes
Ratio: commodity price ÷ gold price, with optional full-history average (Avg) and log-linear trend line (Trend).
Gap to trend %: percentage distance of the ratio from a rolling log-linear regression over N bars. Above zero means rich relative to gold on that horizon; below zero means cheap.
Inputs
Commodity: a preset list of energy, metals, grains, softs, livestock and the S&P 500, plus Chart symbol or Custom.
Gold: the denominator, TVC:GOLD by default.
Trend length: the rolling window for Gap mode. 240 bars on monthly ≈ 20 years (long-run value); 36 ≈ 3 years (short-term stretch).
How it’s calculated
Ratio = commodity close ÷ gold close.
Trend = least-squares fit of ln(ratio) against time, converted back with exp(). The Ratio-mode trend uses all loaded history; Gap mode refits on every bar using only the last N bars.
Notes
Best on a monthly chart with the pane on a log scale. The FRED/IMF series (aluminium, nickel, zinc, iron ore, uranium) are monthly.
History is limited to the main chart’s symbol. Use TVC:GOLD as the main chart for the longest data.
Grains and softs are quoted in cents, so ratio values are ×100. The shape and gaps are unaffected.
The S&P 500 preset is price only, excluding dividends. Use SP:SPXTR via Custom for total return.
Descriptive, not a timing signal.

Thông báo miễn trừ trách nhiệm
Thông tin và các ấn phẩm này không nhằm mục đích, và không cấu thành, lời khuyên hoặc khuyến nghị về tài chính, đầu tư, giao dịch hay các loại khác do TradingView cung cấp hoặc xác nhận. Đọc thêm tại Điều khoản Sử dụng.
Thông báo miễn trừ trách nhiệm
Thông tin và các ấn phẩm này không nhằm mục đích, và không cấu thành, lời khuyên hoặc khuyến nghị về tài chính, đầu tư, giao dịch hay các loại khác do TradingView cung cấp hoặc xác nhận. Đọc thêm tại Điều khoản Sử dụng.