OPEN-SOURCE SCRIPT
SMA Strategy
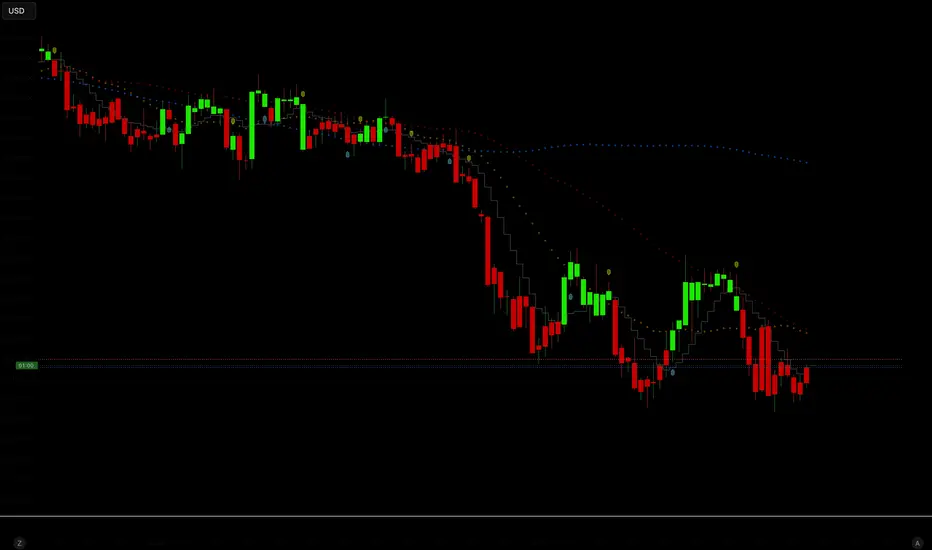
SMA Strategy is a minimalist trend-following trading system built around the interaction of short-term Simple Moving Averages.
The strategy uses the crossover between the SMA 5 and SMA 9 as the primary market trigger, while the SMA 20, SMA 50, and SMA 200 provide additional visual context for short-, medium-, and long-term trend structure.
Core Logic:
A LONG position is opened when the SMA 5 crosses above SMA 9.
A SHORT position is opened when the SMA 5 crosses below SMA 9.
Risk Management
Each trade automatically calculates:
a Stop Loss based on the most recent market structure,
and a Take Profit using a fixed 2:1 risk-to-reward ratio.
For long positions:
Stop Loss = lowest low of the last 5 candles.
Take Profit = entry price + 2× risk.
For short positions:
Stop Loss = highest high of the last 5 candles.
Take Profit = entry price − 2× risk.
This dynamic approach allows the strategy to adapt naturally to changing volatility and price structure.
Visual Features
The script includes multiple visual layers for quick chart interpretation:
SMA 9 displayed as a stepline trigger line.
SMA 20, SMA 50, and SMA 200 plotted as soft circular overlays.
Buy and sell signals plotted directly on the chart.
Candle colors change according to the direction of the SMA 9 trend:
Green candles indicate bullish momentum.
Red candles indicate bearish momentum.
Purpose
The strategy is designed for:
trend continuation trading, short-term momentum detection and clean visual market structure analysis.
Its lightweight construction makes it suitable for discretionary traders, automated backtesting, and further system development.
The strategy uses the crossover between the SMA 5 and SMA 9 as the primary market trigger, while the SMA 20, SMA 50, and SMA 200 provide additional visual context for short-, medium-, and long-term trend structure.
Core Logic:
A LONG position is opened when the SMA 5 crosses above SMA 9.
A SHORT position is opened when the SMA 5 crosses below SMA 9.
Risk Management
Each trade automatically calculates:
a Stop Loss based on the most recent market structure,
and a Take Profit using a fixed 2:1 risk-to-reward ratio.
For long positions:
Stop Loss = lowest low of the last 5 candles.
Take Profit = entry price + 2× risk.
For short positions:
Stop Loss = highest high of the last 5 candles.
Take Profit = entry price − 2× risk.
This dynamic approach allows the strategy to adapt naturally to changing volatility and price structure.
Visual Features
The script includes multiple visual layers for quick chart interpretation:
SMA 9 displayed as a stepline trigger line.
SMA 20, SMA 50, and SMA 200 plotted as soft circular overlays.
Buy and sell signals plotted directly on the chart.
Candle colors change according to the direction of the SMA 9 trend:
Green candles indicate bullish momentum.
Red candles indicate bearish momentum.
Purpose
The strategy is designed for:
trend continuation trading, short-term momentum detection and clean visual market structure analysis.
Its lightweight construction makes it suitable for discretionary traders, automated backtesting, and further system development.
Mã nguồn mở
Theo đúng tinh thần TradingView, tác giả của tập lệnh này đã công bố nó dưới dạng mã nguồn mở, để các nhà giao dịch có thể xem xét và xác minh chức năng. Chúc mừng tác giả! Mặc dù bạn có thể sử dụng miễn phí, hãy nhớ rằng việc công bố lại mã phải tuân theo Nội quy.

Thông báo miễn trừ trách nhiệm
Thông tin và các ấn phẩm này không nhằm mục đích, và không cấu thành, lời khuyên hoặc khuyến nghị về tài chính, đầu tư, giao dịch hay các loại khác do TradingView cung cấp hoặc xác nhận. Đọc thêm tại Điều khoản Sử dụng.
Mã nguồn mở
Theo đúng tinh thần TradingView, tác giả của tập lệnh này đã công bố nó dưới dạng mã nguồn mở, để các nhà giao dịch có thể xem xét và xác minh chức năng. Chúc mừng tác giả! Mặc dù bạn có thể sử dụng miễn phí, hãy nhớ rằng việc công bố lại mã phải tuân theo Nội quy.
Thông báo miễn trừ trách nhiệm
Thông tin và các ấn phẩm này không nhằm mục đích, và không cấu thành, lời khuyên hoặc khuyến nghị về tài chính, đầu tư, giao dịch hay các loại khác do TradingView cung cấp hoặc xác nhận. Đọc thêm tại Điều khoản Sử dụng.