OPEN-SOURCE SCRIPT
Edge 2.3
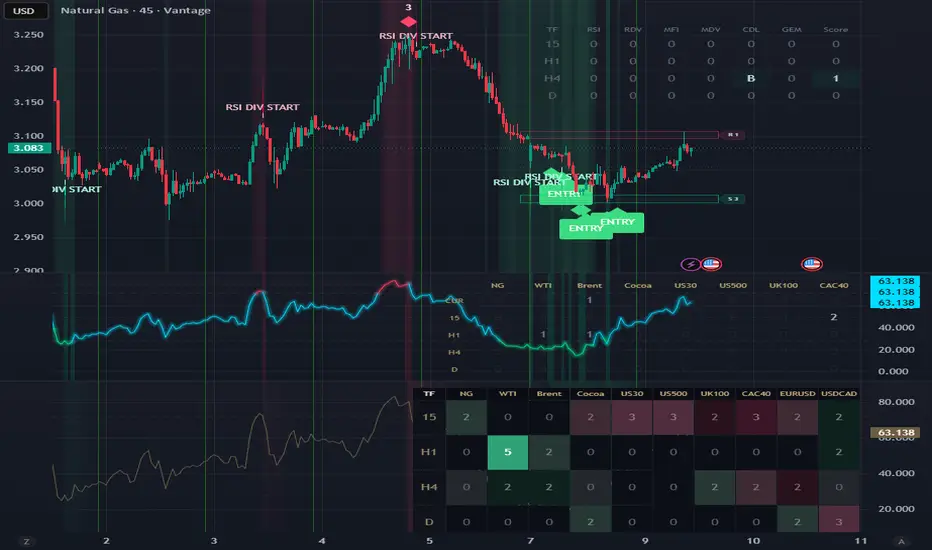
Edge 2.3
Edge 2.3 is a multi-instrument, multi-timeframe score scanner designed to help traders monitor RSI divergence, MFI divergence, volume exhaustion, volatility expansion, and overall reversal pressure across several major markets at the same time.
It combines:
RSI state
RSI divergence
MFI state
MFI divergence
Volume Exhaust
ATR volatility expansion
Multi-timeframe scoring
Multi-instrument monitoring
Hybrid Glass Gold dashboard
RSI visual zone colouring
The purpose is simple:
to help traders quickly identify where strong reversal conditions may be building across different instruments and timeframes without opening every chart manually.
What this indicator does
Edge 2.3 scans several instruments at once and displays a score for each instrument on several timeframes.
The dashboard currently monitors:
NG
WTI
Brent
Cocoa
US30
US500
UK100
CAC40
Timeframes used:
Current chart timeframe
15m
1H
4H
1D
Each cell in the table shows the current signal strength for that instrument and timeframe.
Main idea
Edge 2.3 is not a random buy or sell arrow system.
It is built as a market radar.
It helps answer:
Where is RSI showing divergence?
Where is MFI showing money-flow divergence?
Where is price showing volume exhaustion?
Where is volatility expanding?
Which instruments deserve attention first?
Which timeframes are showing stronger confluence?
Instead of watching one chart at a time, the trader can observe several markets and several timeframes in one compact visual dashboard.
Score system
The table uses a simple score from 0 to 4.
Score 0
No active setup.
There is no meaningful confluence at the moment.
Score 0 is intentionally very transparent so it does not distract the eye.
Score 1
One active factor.
This is an early warning, but usually not enough on its own.
Score 2
Two active factors.
The setup is becoming more interesting, but still requires confirmation from structure and price action.
Score 3
Strong signal.
Three factors are active.
This level deserves attention, especially on H1, H4, or 1D.
Score 4
Premium signal.
This is the strongest condition in this version.
It means several major components are aligning together:
RSI divergence
MFI divergence
Volume Exhaust
ATR extreme volatility
Score 4 does not mean automatic entry.
It means the instrument and timeframe should be checked immediately for market structure, key levels, liquidity, and risk/reward.
Direction
The dashboard shows direction through colour.
Green cells = bullish / buy-side pressure
Red cells = bearish / sell-side pressure
Gold/brown cells = mixed or conflicting pressure
Transparent dark cells = neutral or weak state
Score 3 and Score 4 are visually stronger than Score 1 and Score 2, making it easier to focus on the most important signals.
Main components
RSI divergence
RSI divergence helps identify moments when price makes a new extreme but momentum does not confirm that move.
Bullish RSI divergence:
price makes a lower low
RSI makes a higher low
RSI is in oversold territory
Bearish RSI divergence:
price makes a higher high
RSI makes a lower high
RSI is in overbought territory
MFI divergence
MFI adds money-flow logic to the system.
RSI measures momentum.
MFI adds volume-weighted pressure.
This is useful because price can continue moving while money flow is already weakening.
Bullish MFI divergence suggests selling pressure may be losing power.
Bearish MFI divergence suggests buying pressure may be losing power.
Volume Exhaust
Volume Exhaust is designed to detect a possible final aggressive movement before reversal.
Buy-side exhaustion looks for:
high volume
long lower wick
RSI below oversold level
Sell-side exhaustion looks for:
high volume
long upper wick
RSI above overbought level
This helps identify moments where the market may be making a final push, while candle structure shows rejection.
ATR volatility expansion
ATR does not create direction by itself.
It only strengthens an existing buy or sell setup.
A divergence signal during expanding volatility may be more meaningful than the same signal during a flat, inactive market.
RSI visual line
Edge 2.3 also includes a clean RSI visual panel.
RSI line colours:
Blue = neutral zone
Red = overbought zone
Green = oversold zone
When RSI divergence appears, the indicator can also show a soft background glow:
red glow for bearish RSI divergence
green glow for bullish RSI divergence
This helps connect the table signal with the current chart condition.
Dashboard design
Edge 2.3 uses a Hybrid Glass Gold dashboard style.
Main visual features:
transparent glass-style cells
soft gold headers
low-distraction neutral states
very faded zero values
stronger colour only when signal quality improves
green premium buy cells
red premium sell cells
compact multi-timeframe layout
The table is designed so the trader’s eye naturally ignores weak areas and focuses on active opportunities.
How to use it
For beginners
Use the dashboard as a market checklist.
Start by looking for Score 3 and Score 4.
Ignore most Score 0 cells.
When a strong score appears:
open that instrument
check the same timeframe
look at support and resistance
check trend structure
check candle reaction
decide whether there is a valid trade setup
Do not enter only because a number appears in the table.
For experienced traders
A practical workflow:
Use 1D and H4 for higher-timeframe reversal zones
Use H1 for structure and confirmation
Use 15m for entry timing
Treat Score 4 as the main watchlist trigger
Treat Score 3 as a strong alert condition
Use Score 1 and Score 2 as early warnings only
The strongest situations usually occur when several timeframes begin to align in the same direction.
Example bullish setup
If NG shows:
H4 = 4 green
H1 = 3 green
15m = 2 or 3 green
this may suggest that bullish reversal pressure is building across multiple timeframes.
The next step is to open the chart and check:
market structure
support zone
liquidity sweep
rejection candle
risk/reward
confirmation trigger
Example bearish setup
If US500 shows:
D = 3 red
H4 = 4 red
H1 = 3 red
this may suggest that bearish reversal pressure is building.
The trader should then check:
resistance zone
failed breakout
upper wick rejection
trend exhaustion
risk level
possible downside target
Best use cases
This indicator is useful for:
multi-timeframe analysis
multi-instrument monitoring
reversal scanning
divergence analysis
commodity monitoring
index monitoring
volume exhaustion detection
high-volatility reversal setups
watchlist filtering
finding where attention should go first
Main advantages
Edge 2.3 allows traders to monitor several instruments at the same time.
Instead of checking each chart manually, the dashboard shows where the strongest conditions are building.
It helps reduce noise by making weak conditions visually quiet and strong conditions visually clear.
It combines momentum, money flow, volume exhaustion, and volatility into one compact score.
It helps traders focus on quality, not quantity.
Important note
This is not:
a guaranteed entry system
a financial advice tool
a replacement for risk management
a replacement for market structure
a standalone automatic trading system
It is a decision-support scanner.
Use it together with:
trend structure
support and resistance
liquidity context
key levels
candlestick confirmation
risk management
position sizing
Release Notes — Edge 2.3
Converted to Pine Script v6
Added RSI + MFI divergence engine
Added Volume Exhaust logic
Added ATR extreme volatility boost
Built multi-instrument scanner
Built multi-timeframe score table
Added Score 0–4 system
Added premium Score 4 alerts
Added RSI colour-zone visual line
Added RSI divergence background glow
Added Hybrid Glass Gold dashboard design
Added transparent zero-fade cells
Improved readability and reduced visual noise
Designed for fast monitoring of several markets at once
Edge 2.3 is a multi-instrument, multi-timeframe score scanner designed to help traders monitor RSI divergence, MFI divergence, volume exhaustion, volatility expansion, and overall reversal pressure across several major markets at the same time.
It combines:
RSI state
RSI divergence
MFI state
MFI divergence
Volume Exhaust
ATR volatility expansion
Multi-timeframe scoring
Multi-instrument monitoring
Hybrid Glass Gold dashboard
RSI visual zone colouring
The purpose is simple:
to help traders quickly identify where strong reversal conditions may be building across different instruments and timeframes without opening every chart manually.
What this indicator does
Edge 2.3 scans several instruments at once and displays a score for each instrument on several timeframes.
The dashboard currently monitors:
NG
WTI
Brent
Cocoa
US30
US500
UK100
CAC40
Timeframes used:
Current chart timeframe
15m
1H
4H
1D
Each cell in the table shows the current signal strength for that instrument and timeframe.
Main idea
Edge 2.3 is not a random buy or sell arrow system.
It is built as a market radar.
It helps answer:
Where is RSI showing divergence?
Where is MFI showing money-flow divergence?
Where is price showing volume exhaustion?
Where is volatility expanding?
Which instruments deserve attention first?
Which timeframes are showing stronger confluence?
Instead of watching one chart at a time, the trader can observe several markets and several timeframes in one compact visual dashboard.
Score system
The table uses a simple score from 0 to 4.
Score 0
No active setup.
There is no meaningful confluence at the moment.
Score 0 is intentionally very transparent so it does not distract the eye.
Score 1
One active factor.
This is an early warning, but usually not enough on its own.
Score 2
Two active factors.
The setup is becoming more interesting, but still requires confirmation from structure and price action.
Score 3
Strong signal.
Three factors are active.
This level deserves attention, especially on H1, H4, or 1D.
Score 4
Premium signal.
This is the strongest condition in this version.
It means several major components are aligning together:
RSI divergence
MFI divergence
Volume Exhaust
ATR extreme volatility
Score 4 does not mean automatic entry.
It means the instrument and timeframe should be checked immediately for market structure, key levels, liquidity, and risk/reward.
Direction
The dashboard shows direction through colour.
Green cells = bullish / buy-side pressure
Red cells = bearish / sell-side pressure
Gold/brown cells = mixed or conflicting pressure
Transparent dark cells = neutral or weak state
Score 3 and Score 4 are visually stronger than Score 1 and Score 2, making it easier to focus on the most important signals.
Main components
RSI divergence
RSI divergence helps identify moments when price makes a new extreme but momentum does not confirm that move.
Bullish RSI divergence:
price makes a lower low
RSI makes a higher low
RSI is in oversold territory
Bearish RSI divergence:
price makes a higher high
RSI makes a lower high
RSI is in overbought territory
MFI divergence
MFI adds money-flow logic to the system.
RSI measures momentum.
MFI adds volume-weighted pressure.
This is useful because price can continue moving while money flow is already weakening.
Bullish MFI divergence suggests selling pressure may be losing power.
Bearish MFI divergence suggests buying pressure may be losing power.
Volume Exhaust
Volume Exhaust is designed to detect a possible final aggressive movement before reversal.
Buy-side exhaustion looks for:
high volume
long lower wick
RSI below oversold level
Sell-side exhaustion looks for:
high volume
long upper wick
RSI above overbought level
This helps identify moments where the market may be making a final push, while candle structure shows rejection.
ATR volatility expansion
ATR does not create direction by itself.
It only strengthens an existing buy or sell setup.
A divergence signal during expanding volatility may be more meaningful than the same signal during a flat, inactive market.
RSI visual line
Edge 2.3 also includes a clean RSI visual panel.
RSI line colours:
Blue = neutral zone
Red = overbought zone
Green = oversold zone
When RSI divergence appears, the indicator can also show a soft background glow:
red glow for bearish RSI divergence
green glow for bullish RSI divergence
This helps connect the table signal with the current chart condition.
Dashboard design
Edge 2.3 uses a Hybrid Glass Gold dashboard style.
Main visual features:
transparent glass-style cells
soft gold headers
low-distraction neutral states
very faded zero values
stronger colour only when signal quality improves
green premium buy cells
red premium sell cells
compact multi-timeframe layout
The table is designed so the trader’s eye naturally ignores weak areas and focuses on active opportunities.
How to use it
For beginners
Use the dashboard as a market checklist.
Start by looking for Score 3 and Score 4.
Ignore most Score 0 cells.
When a strong score appears:
open that instrument
check the same timeframe
look at support and resistance
check trend structure
check candle reaction
decide whether there is a valid trade setup
Do not enter only because a number appears in the table.
For experienced traders
A practical workflow:
Use 1D and H4 for higher-timeframe reversal zones
Use H1 for structure and confirmation
Use 15m for entry timing
Treat Score 4 as the main watchlist trigger
Treat Score 3 as a strong alert condition
Use Score 1 and Score 2 as early warnings only
The strongest situations usually occur when several timeframes begin to align in the same direction.
Example bullish setup
If NG shows:
H4 = 4 green
H1 = 3 green
15m = 2 or 3 green
this may suggest that bullish reversal pressure is building across multiple timeframes.
The next step is to open the chart and check:
market structure
support zone
liquidity sweep
rejection candle
risk/reward
confirmation trigger
Example bearish setup
If US500 shows:
D = 3 red
H4 = 4 red
H1 = 3 red
this may suggest that bearish reversal pressure is building.
The trader should then check:
resistance zone
failed breakout
upper wick rejection
trend exhaustion
risk level
possible downside target
Best use cases
This indicator is useful for:
multi-timeframe analysis
multi-instrument monitoring
reversal scanning
divergence analysis
commodity monitoring
index monitoring
volume exhaustion detection
high-volatility reversal setups
watchlist filtering
finding where attention should go first
Main advantages
Edge 2.3 allows traders to monitor several instruments at the same time.
Instead of checking each chart manually, the dashboard shows where the strongest conditions are building.
It helps reduce noise by making weak conditions visually quiet and strong conditions visually clear.
It combines momentum, money flow, volume exhaustion, and volatility into one compact score.
It helps traders focus on quality, not quantity.
Important note
This is not:
a guaranteed entry system
a financial advice tool
a replacement for risk management
a replacement for market structure
a standalone automatic trading system
It is a decision-support scanner.
Use it together with:
trend structure
support and resistance
liquidity context
key levels
candlestick confirmation
risk management
position sizing
Release Notes — Edge 2.3
Converted to Pine Script v6
Added RSI + MFI divergence engine
Added Volume Exhaust logic
Added ATR extreme volatility boost
Built multi-instrument scanner
Built multi-timeframe score table
Added Score 0–4 system
Added premium Score 4 alerts
Added RSI colour-zone visual line
Added RSI divergence background glow
Added Hybrid Glass Gold dashboard design
Added transparent zero-fade cells
Improved readability and reduced visual noise
Designed for fast monitoring of several markets at once
Mã nguồn mở
Theo đúng tinh thần TradingView, tác giả của tập lệnh này đã công bố nó dưới dạng mã nguồn mở, để các nhà giao dịch có thể xem xét và xác minh chức năng. Chúc mừng tác giả! Mặc dù bạn có thể sử dụng miễn phí, hãy nhớ rằng việc công bố lại mã phải tuân theo Nội quy.

Thông báo miễn trừ trách nhiệm
Thông tin và các ấn phẩm này không nhằm mục đích, và không cấu thành, lời khuyên hoặc khuyến nghị về tài chính, đầu tư, giao dịch hay các loại khác do TradingView cung cấp hoặc xác nhận. Đọc thêm tại Điều khoản Sử dụng.
Mã nguồn mở
Theo đúng tinh thần TradingView, tác giả của tập lệnh này đã công bố nó dưới dạng mã nguồn mở, để các nhà giao dịch có thể xem xét và xác minh chức năng. Chúc mừng tác giả! Mặc dù bạn có thể sử dụng miễn phí, hãy nhớ rằng việc công bố lại mã phải tuân theo Nội quy.
Thông báo miễn trừ trách nhiệm
Thông tin và các ấn phẩm này không nhằm mục đích, và không cấu thành, lời khuyên hoặc khuyến nghị về tài chính, đầu tư, giao dịch hay các loại khác do TradingView cung cấp hoặc xác nhận. Đọc thêm tại Điều khoản Sử dụng.