Cập nhật
Overnight Gap Fill Tracker
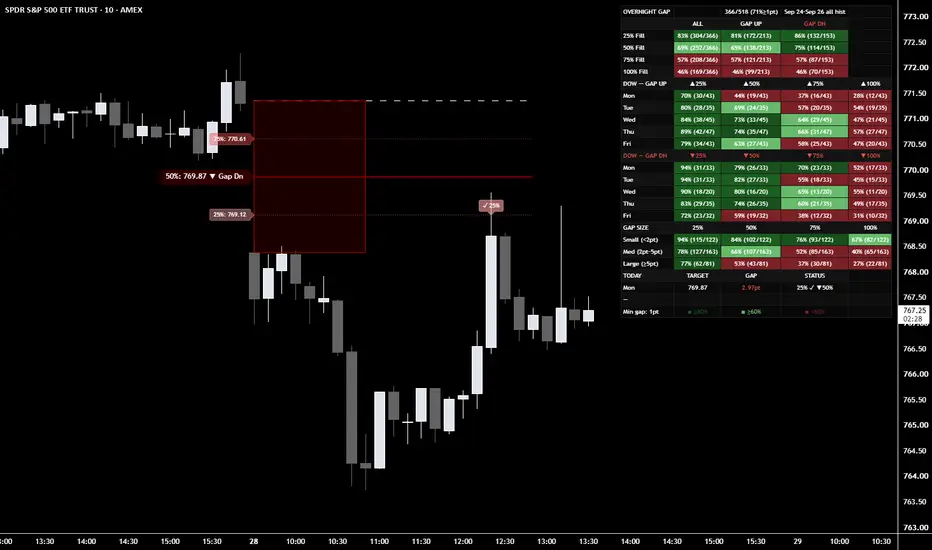
Overnight Gap Fill Tracker measures how often the opening gap on a stock or ETF is retraced during the same regular session. It breaks the results down by retracement depth, weekday, and gap size.
FIRST-TIME SETUP (PLEASE READ)
The default settings are scaled for SPX-level prices (min gap 10, size buckets 25 / 50, bounce distance 8, Dollar mode). On SPY, QQQ or a typical stock, those defaults filter out almost every gap, so the table will look empty until you adjust them. Open the indicator Settings and do ONE of these:
- Easiest: set "Gap measurement unit" (General) to Percent. The percent defaults (min gap 0.15%, small below 0.30%, large from 0.65%) work across symbols and price levels. SPY works out to roughly $1 min gap and $2 / $5 buckets.
- Or stay in Dollar mode and enter values for your symbol: "Min gap size ($)", "Small gap max ($)" and "Large gap min ($)". Example starting points: SPY 1 / 2 / 5, SPX 10 / 20 / 50.
Also set "Bounce min move (pts)". It is always in price units, even in Percent mode (example: SPY 1, SPX 10). The bounce rows are hidden by default and only matter if you turn them on.
Changing any setting recalculates all statistics from the bars on your chart.
WHAT IT DOES
1. At the first regular-session bar (09:30 New York time) it measures the gap: today's open minus the previous session's close, taken from the prior daily bar. Gaps below a user-set minimum are ignored.
2. It draws the gap zone, the prior close, and the 25%, 50% and 75% retracement levels, measured from the open back toward the prior close. The chart shows the most recent N gaps (adjustable).
3. During the session it compares each bar's high/low to those levels and records which were reached: 25%, 50%, 75%, and 100% (a full fill back to the prior close). The opening bar counts.
4. Each finished session is stored in a log. The statistics table is calculated from that log, using every gap on the chart or only the last N sessions if a lookback is set.
THE TABLE
- Fill rates at 25/50/75/100%: all gaps, gap-up only, gap-down only, shown with counts (hits/total).
- Fill rates by weekday, shown separately for gap-up and gap-down.
- Fill rates by gap size (small/medium/large, all gaps combined). Bucket edges are yours to set, either in price units or as a percent of price. Percent mode lets the same buckets work across symbols with different prices, and keeps them consistent as price drifts over the years.
- Optional bounce and continuation rows. Bounce: after the 50% level is touched, price moves back in the original gap direction by at least a set distance within a set number of bars. Continuation: the share of 50% touches that go on to a full fill.
- A TODAY row showing the current gap, its 50% target, fill status, and how often gaps on this weekday in the same direction have reached 50%.
- The gap-up and gap-down columns can be hidden, and most sections toggled, to shrink the table. Color themes include a colorblind-safe palette.
WHAT IT ADDS
Plotting the prior close and retracement levels is common. This script adds the statistics layer: a per-session log that feeds the fill-depth, weekday and size breakdowns, plus bounce/continuation tracking and a weekday-conditional TODAY row, all recalculated from the bars on your chart. The code is open so you can see exactly how each statistic is counted.
HOW TO USE
- Use an intraday chart (for example 5 or 15 minutes) with standard candles or bars, set to regular trading hours, on a symbol with one regular session per day (US stocks, ETFs, indices such as SPX).
- Complete the first-time setup above for your symbol.
LIMITATIONS
- The statistics describe past behavior of the bars loaded on your chart. They are not predictions or trade signals. Sample depth depends on how much intraday history your plan loads; the table header shows the date range and session count. Some cells (a single weekday, large gaps) can have small samples, so check the counts.
- Continuous futures are not supported: session boundaries and contract rolls distort what counts as an overnight gap.
- Non-standard chart types (Heikin Ashi, Renko, etc.) are not supported because their open/close values are not real prices.
- With extended hours enabled, the script may not detect the session open. Use the regular-hours setting.
- The current, unfinished session is included in the table, so today's numbers can change until the close.
- On a regular-hours chart, the table does not update for a new day until the market opens.
REPAINTING / LOOKAHEAD
The gap and retracement levels are fixed at the session's first bar using the previous daily close, requested with a one-bar offset so there is no lookahead. Fill flags use each bar's high/low, including the live bar. Once a level is touched it stays touched, so historical results do not change on reload.
This is a statistics tool for study, not financial advice.
FIRST-TIME SETUP (PLEASE READ)
The default settings are scaled for SPX-level prices (min gap 10, size buckets 25 / 50, bounce distance 8, Dollar mode). On SPY, QQQ or a typical stock, those defaults filter out almost every gap, so the table will look empty until you adjust them. Open the indicator Settings and do ONE of these:
- Easiest: set "Gap measurement unit" (General) to Percent. The percent defaults (min gap 0.15%, small below 0.30%, large from 0.65%) work across symbols and price levels. SPY works out to roughly $1 min gap and $2 / $5 buckets.
- Or stay in Dollar mode and enter values for your symbol: "Min gap size ($)", "Small gap max ($)" and "Large gap min ($)". Example starting points: SPY 1 / 2 / 5, SPX 10 / 20 / 50.
Also set "Bounce min move (pts)". It is always in price units, even in Percent mode (example: SPY 1, SPX 10). The bounce rows are hidden by default and only matter if you turn them on.
Changing any setting recalculates all statistics from the bars on your chart.
WHAT IT DOES
1. At the first regular-session bar (09:30 New York time) it measures the gap: today's open minus the previous session's close, taken from the prior daily bar. Gaps below a user-set minimum are ignored.
2. It draws the gap zone, the prior close, and the 25%, 50% and 75% retracement levels, measured from the open back toward the prior close. The chart shows the most recent N gaps (adjustable).
3. During the session it compares each bar's high/low to those levels and records which were reached: 25%, 50%, 75%, and 100% (a full fill back to the prior close). The opening bar counts.
4. Each finished session is stored in a log. The statistics table is calculated from that log, using every gap on the chart or only the last N sessions if a lookback is set.
THE TABLE
- Fill rates at 25/50/75/100%: all gaps, gap-up only, gap-down only, shown with counts (hits/total).
- Fill rates by weekday, shown separately for gap-up and gap-down.
- Fill rates by gap size (small/medium/large, all gaps combined). Bucket edges are yours to set, either in price units or as a percent of price. Percent mode lets the same buckets work across symbols with different prices, and keeps them consistent as price drifts over the years.
- Optional bounce and continuation rows. Bounce: after the 50% level is touched, price moves back in the original gap direction by at least a set distance within a set number of bars. Continuation: the share of 50% touches that go on to a full fill.
- A TODAY row showing the current gap, its 50% target, fill status, and how often gaps on this weekday in the same direction have reached 50%.
- The gap-up and gap-down columns can be hidden, and most sections toggled, to shrink the table. Color themes include a colorblind-safe palette.
WHAT IT ADDS
Plotting the prior close and retracement levels is common. This script adds the statistics layer: a per-session log that feeds the fill-depth, weekday and size breakdowns, plus bounce/continuation tracking and a weekday-conditional TODAY row, all recalculated from the bars on your chart. The code is open so you can see exactly how each statistic is counted.
HOW TO USE
- Use an intraday chart (for example 5 or 15 minutes) with standard candles or bars, set to regular trading hours, on a symbol with one regular session per day (US stocks, ETFs, indices such as SPX).
- Complete the first-time setup above for your symbol.
LIMITATIONS
- The statistics describe past behavior of the bars loaded on your chart. They are not predictions or trade signals. Sample depth depends on how much intraday history your plan loads; the table header shows the date range and session count. Some cells (a single weekday, large gaps) can have small samples, so check the counts.
- Continuous futures are not supported: session boundaries and contract rolls distort what counts as an overnight gap.
- Non-standard chart types (Heikin Ashi, Renko, etc.) are not supported because their open/close values are not real prices.
- With extended hours enabled, the script may not detect the session open. Use the regular-hours setting.
- The current, unfinished session is included in the table, so today's numbers can change until the close.
- On a regular-hours chart, the table does not update for a new day until the market opens.
REPAINTING / LOOKAHEAD
The gap and retracement levels are fixed at the session's first bar using the previous daily close, requested with a one-bar offset so there is no lookahead. Fill flags use each bar's high/low, including the live bar. Once a level is touched it stays touched, so historical results do not change on reload.
This is a statistics tool for study, not financial advice.
Phát hành các Ghi chú
Fixed the duplicate-logging bug: removed the barstate.islast block that was pushing a new log entry every tick while today's session was live; today's session now logs exactly once, when the next day opens
Thông báo miễn trừ trách nhiệm
Thông tin và các ấn phẩm này không nhằm mục đích, và không cấu thành, lời khuyên hoặc khuyến nghị về tài chính, đầu tư, giao dịch hay các loại khác do TradingView cung cấp hoặc xác nhận. Đọc thêm tại Điều khoản Sử dụng.
Thông báo miễn trừ trách nhiệm
Thông tin và các ấn phẩm này không nhằm mục đích, và không cấu thành, lời khuyên hoặc khuyến nghị về tài chính, đầu tư, giao dịch hay các loại khác do TradingView cung cấp hoặc xác nhận. Đọc thêm tại Điều khoản Sử dụng.